> ## Documentation Index
> Fetch the complete documentation index at: https://docs.composo.ai/llms.txt
> Use this file to discover all available pages before exploring further.
# Composo x Metabase
> Explore and Visualize Composo Evaluations
## Introduction
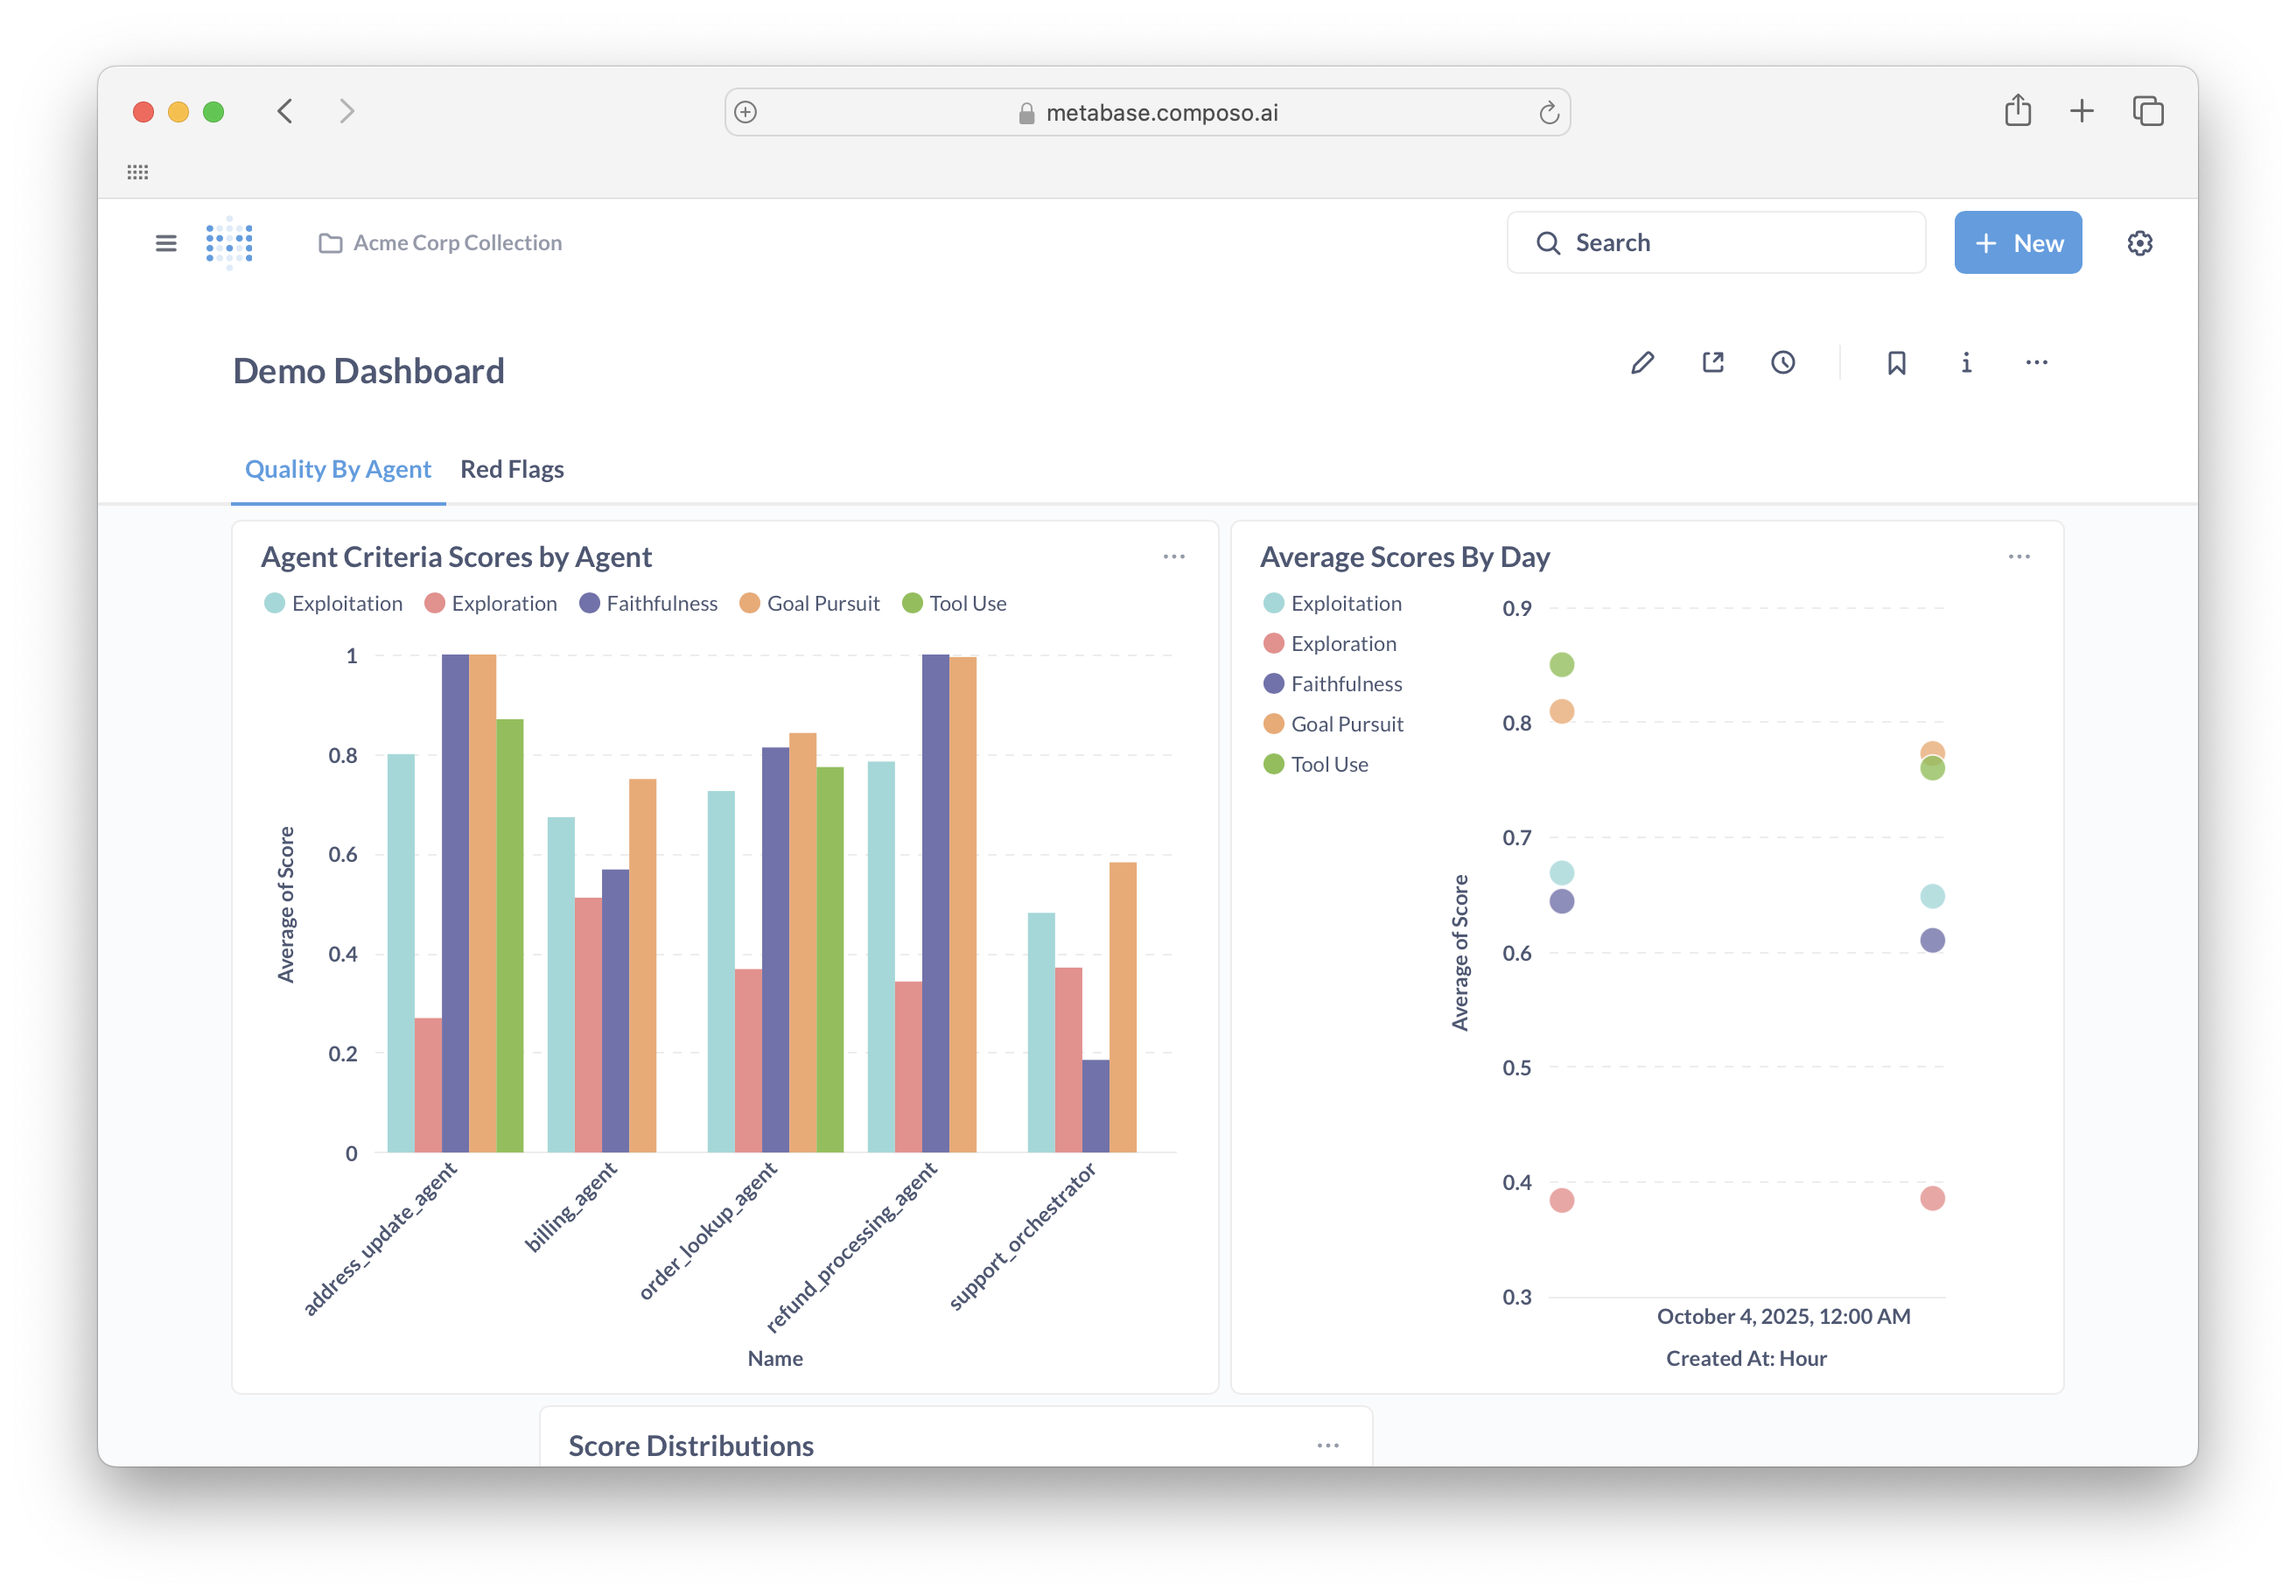
Composo provides a hosted Metabase instance where you can explore and visualize your LLM evaluation data. Query your historical evaluation runs, track quality metrics over time, and build dashboards to monitor your AI applications in development and production.
**Getting Started**: Metabase access requires onboarding. Please email [support@composo.ai](mailto:support@composo.ai) or contact your Composo rep to get set up with your evaluation database.
 ***
## What is Metabase?
Metabase is an open-source business intelligence tool that lets you ask questions about your data and visualize the answers. No SQL required for basic queries, though it's available when you need it.
For comprehensive Metabase documentation, see: [Metabase Documentation](https://www.metabase.com/docs/latest/)
***
## Your Data in Composo
### Your Evaluation Database
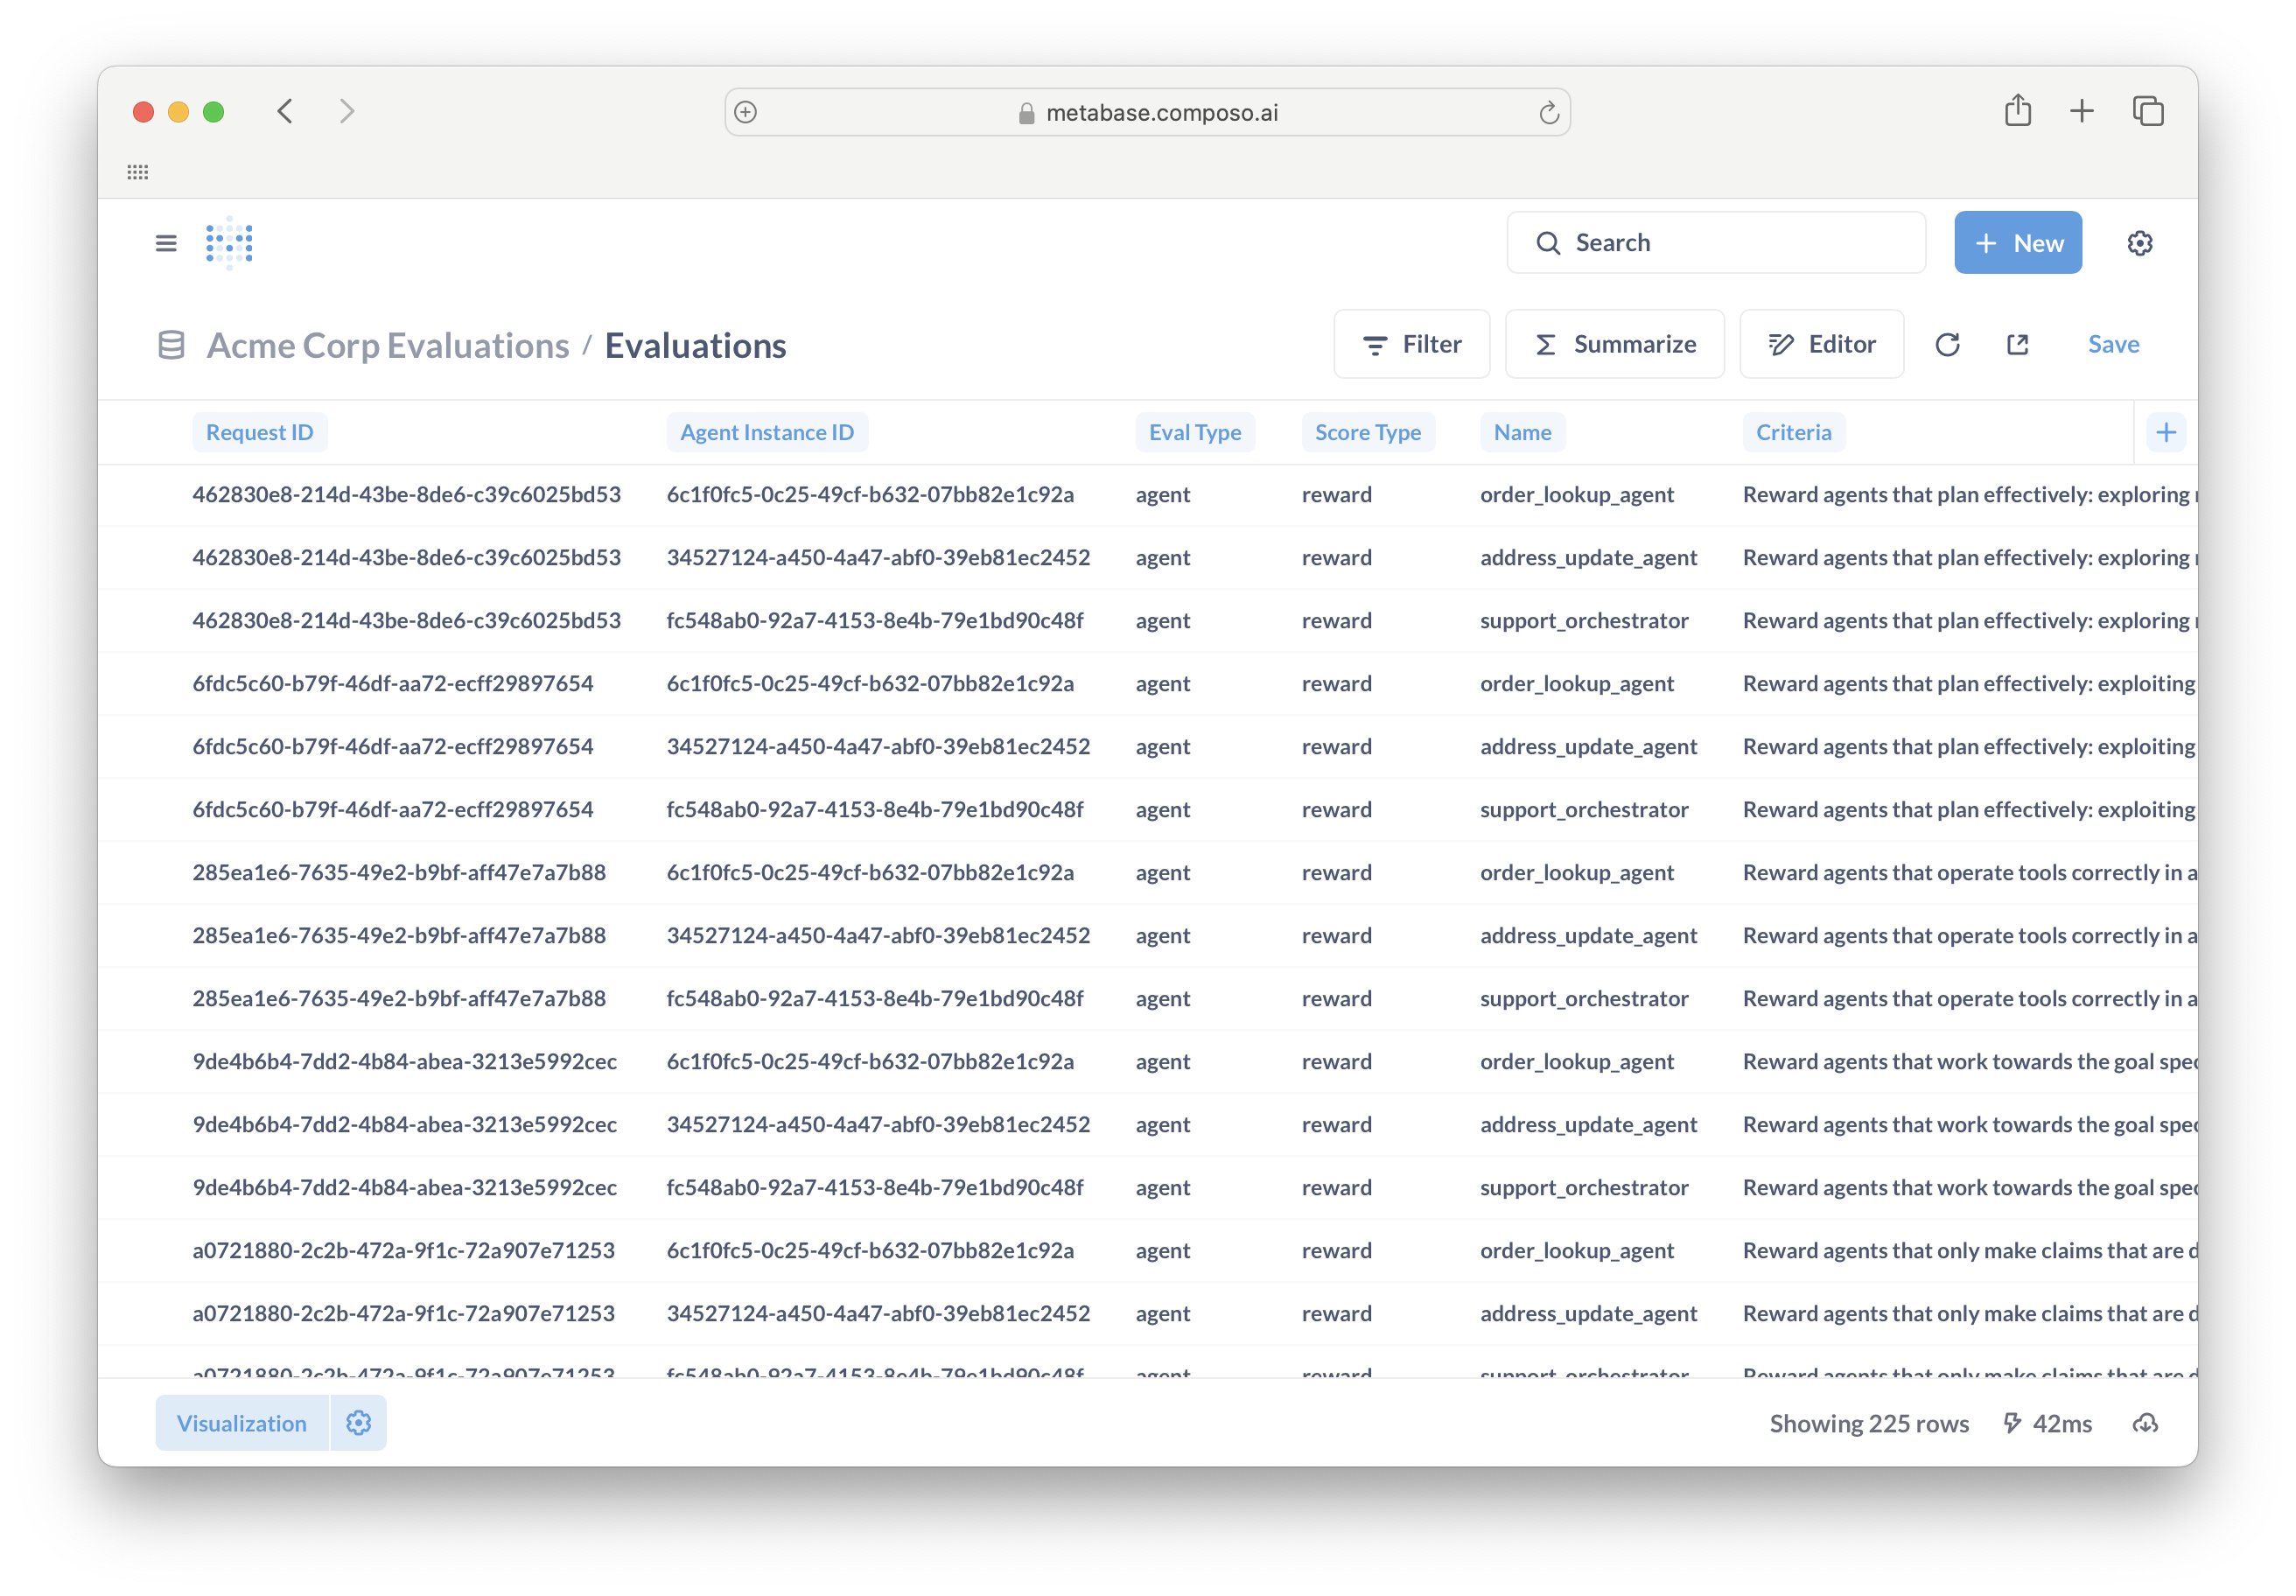
Your evaluation data is organized in a dedicated database that you can explore and query. The database contains your complete evaluation history with detailed metrics and metadata for each run.
***
## What is Metabase?
Metabase is an open-source business intelligence tool that lets you ask questions about your data and visualize the answers. No SQL required for basic queries, though it's available when you need it.
For comprehensive Metabase documentation, see: [Metabase Documentation](https://www.metabase.com/docs/latest/)
***
## Your Data in Composo
### Your Evaluation Database
Your evaluation data is organized in a dedicated database that you can explore and query. The database contains your complete evaluation history with detailed metrics and metadata for each run.
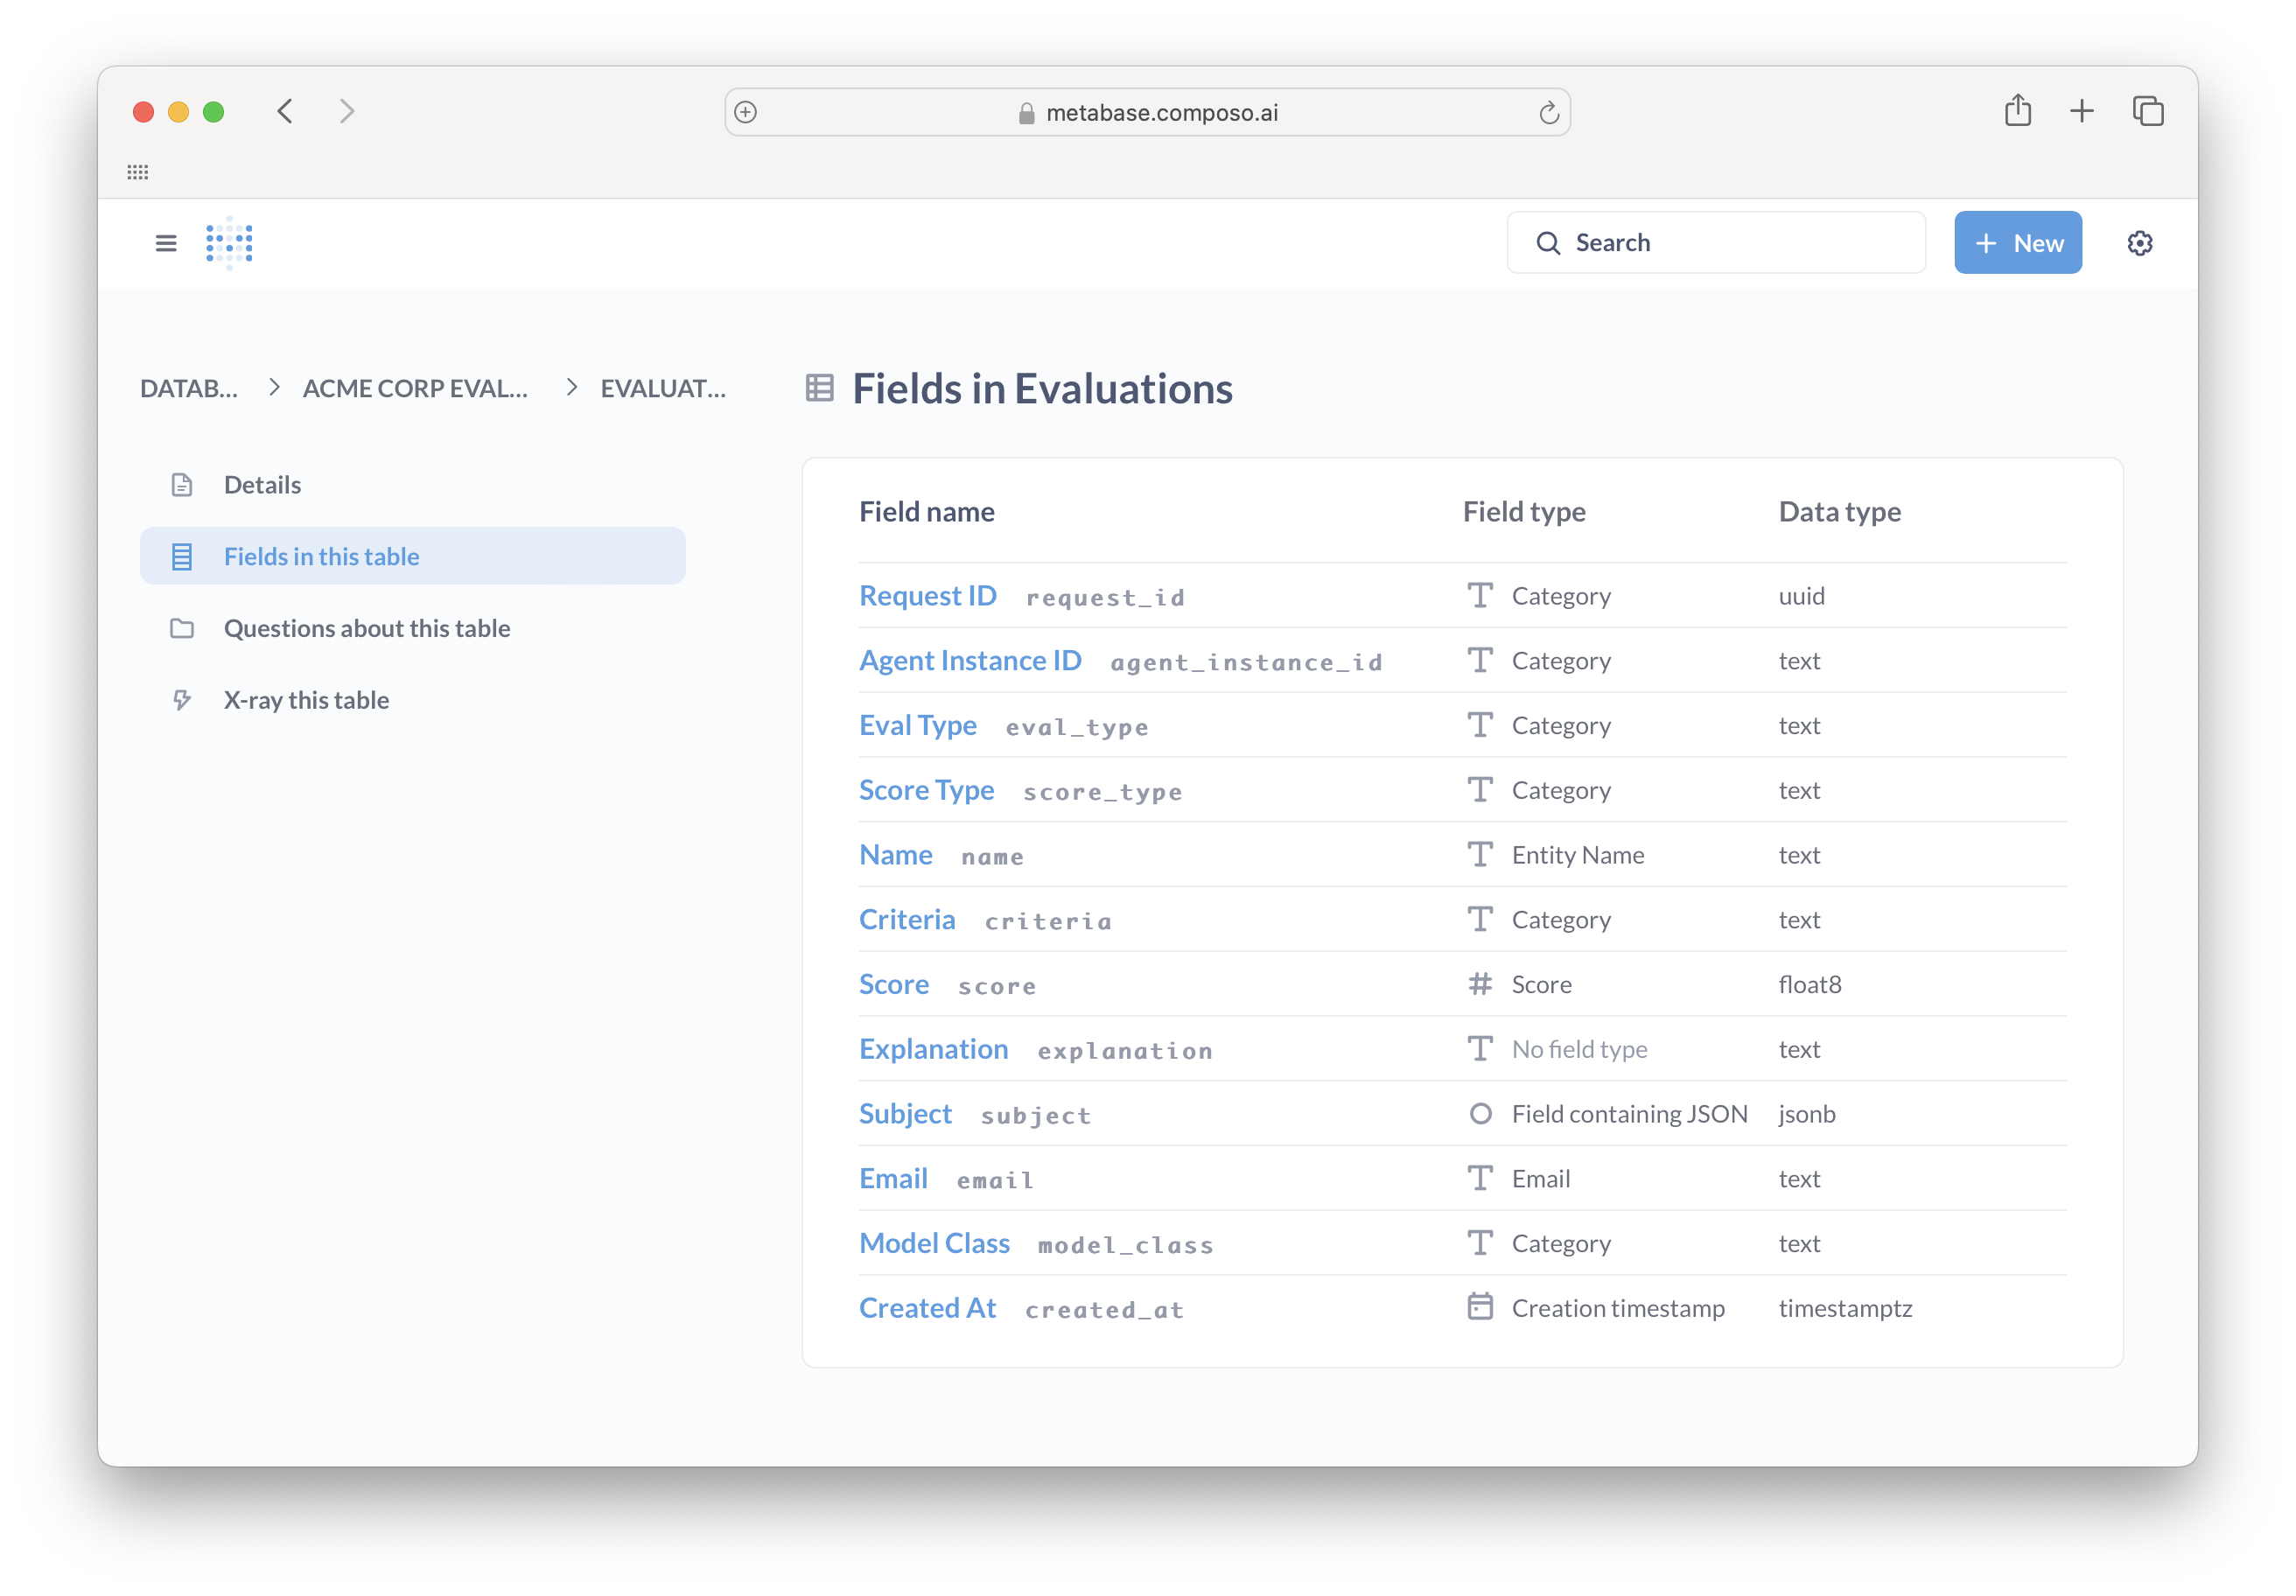
 Key fields include:
* **Request ID**: Unique identifier for each evaluation request (UUID)
* **Agent Instance ID**: Identifier for the specific agent instance being evaluated (null for response/tool evaluations)
* **Eval Type**: Type of evaluation - `response` (LLM responses), `tool` (tool usage), `agent` (multi-agent traces), or `chatsession` (chat-based agent evaluations)
* **Score Type**: How the score should be interpreted - `reward` (continuous 0-1 score) or `binary` (pass/fail converted to 1.0/0.0)
* **Name**: Agent name for multi-agent evaluations (null for response/tool evaluations)
* **Criteria**: Full evaluation criteria text (starts with prefixes like "Reward responses", "Passes if", etc.)
* **Score**: Numerical result (0-1 scale, where higher is better; null if criteria not applicable)
* **Explanation**: Detailed reasoning and analysis behind the score
* **Subject**: JSON data containing what was evaluated:
* For response/tool evaluations: `{messages, tools, system}` - the conversation and available tools
* For agent evaluations: The specific agent instance interactions being evaluated
* **Email**: User who ran the evaluation
* **Model Class**: The evaluation model used (e.g., "align-lightning")
* **Created At**: Timestamp when the evaluation was performed
Key fields include:
* **Request ID**: Unique identifier for each evaluation request (UUID)
* **Agent Instance ID**: Identifier for the specific agent instance being evaluated (null for response/tool evaluations)
* **Eval Type**: Type of evaluation - `response` (LLM responses), `tool` (tool usage), `agent` (multi-agent traces), or `chatsession` (chat-based agent evaluations)
* **Score Type**: How the score should be interpreted - `reward` (continuous 0-1 score) or `binary` (pass/fail converted to 1.0/0.0)
* **Name**: Agent name for multi-agent evaluations (null for response/tool evaluations)
* **Criteria**: Full evaluation criteria text (starts with prefixes like "Reward responses", "Passes if", etc.)
* **Score**: Numerical result (0-1 scale, where higher is better; null if criteria not applicable)
* **Explanation**: Detailed reasoning and analysis behind the score
* **Subject**: JSON data containing what was evaluated:
* For response/tool evaluations: `{messages, tools, system}` - the conversation and available tools
* For agent evaluations: The specific agent instance interactions being evaluated
* **Email**: User who ran the evaluation
* **Model Class**: The evaluation model used (e.g., "align-lightning")
* **Created At**: Timestamp when the evaluation was performed
 ### Viewing Individual Evaluations
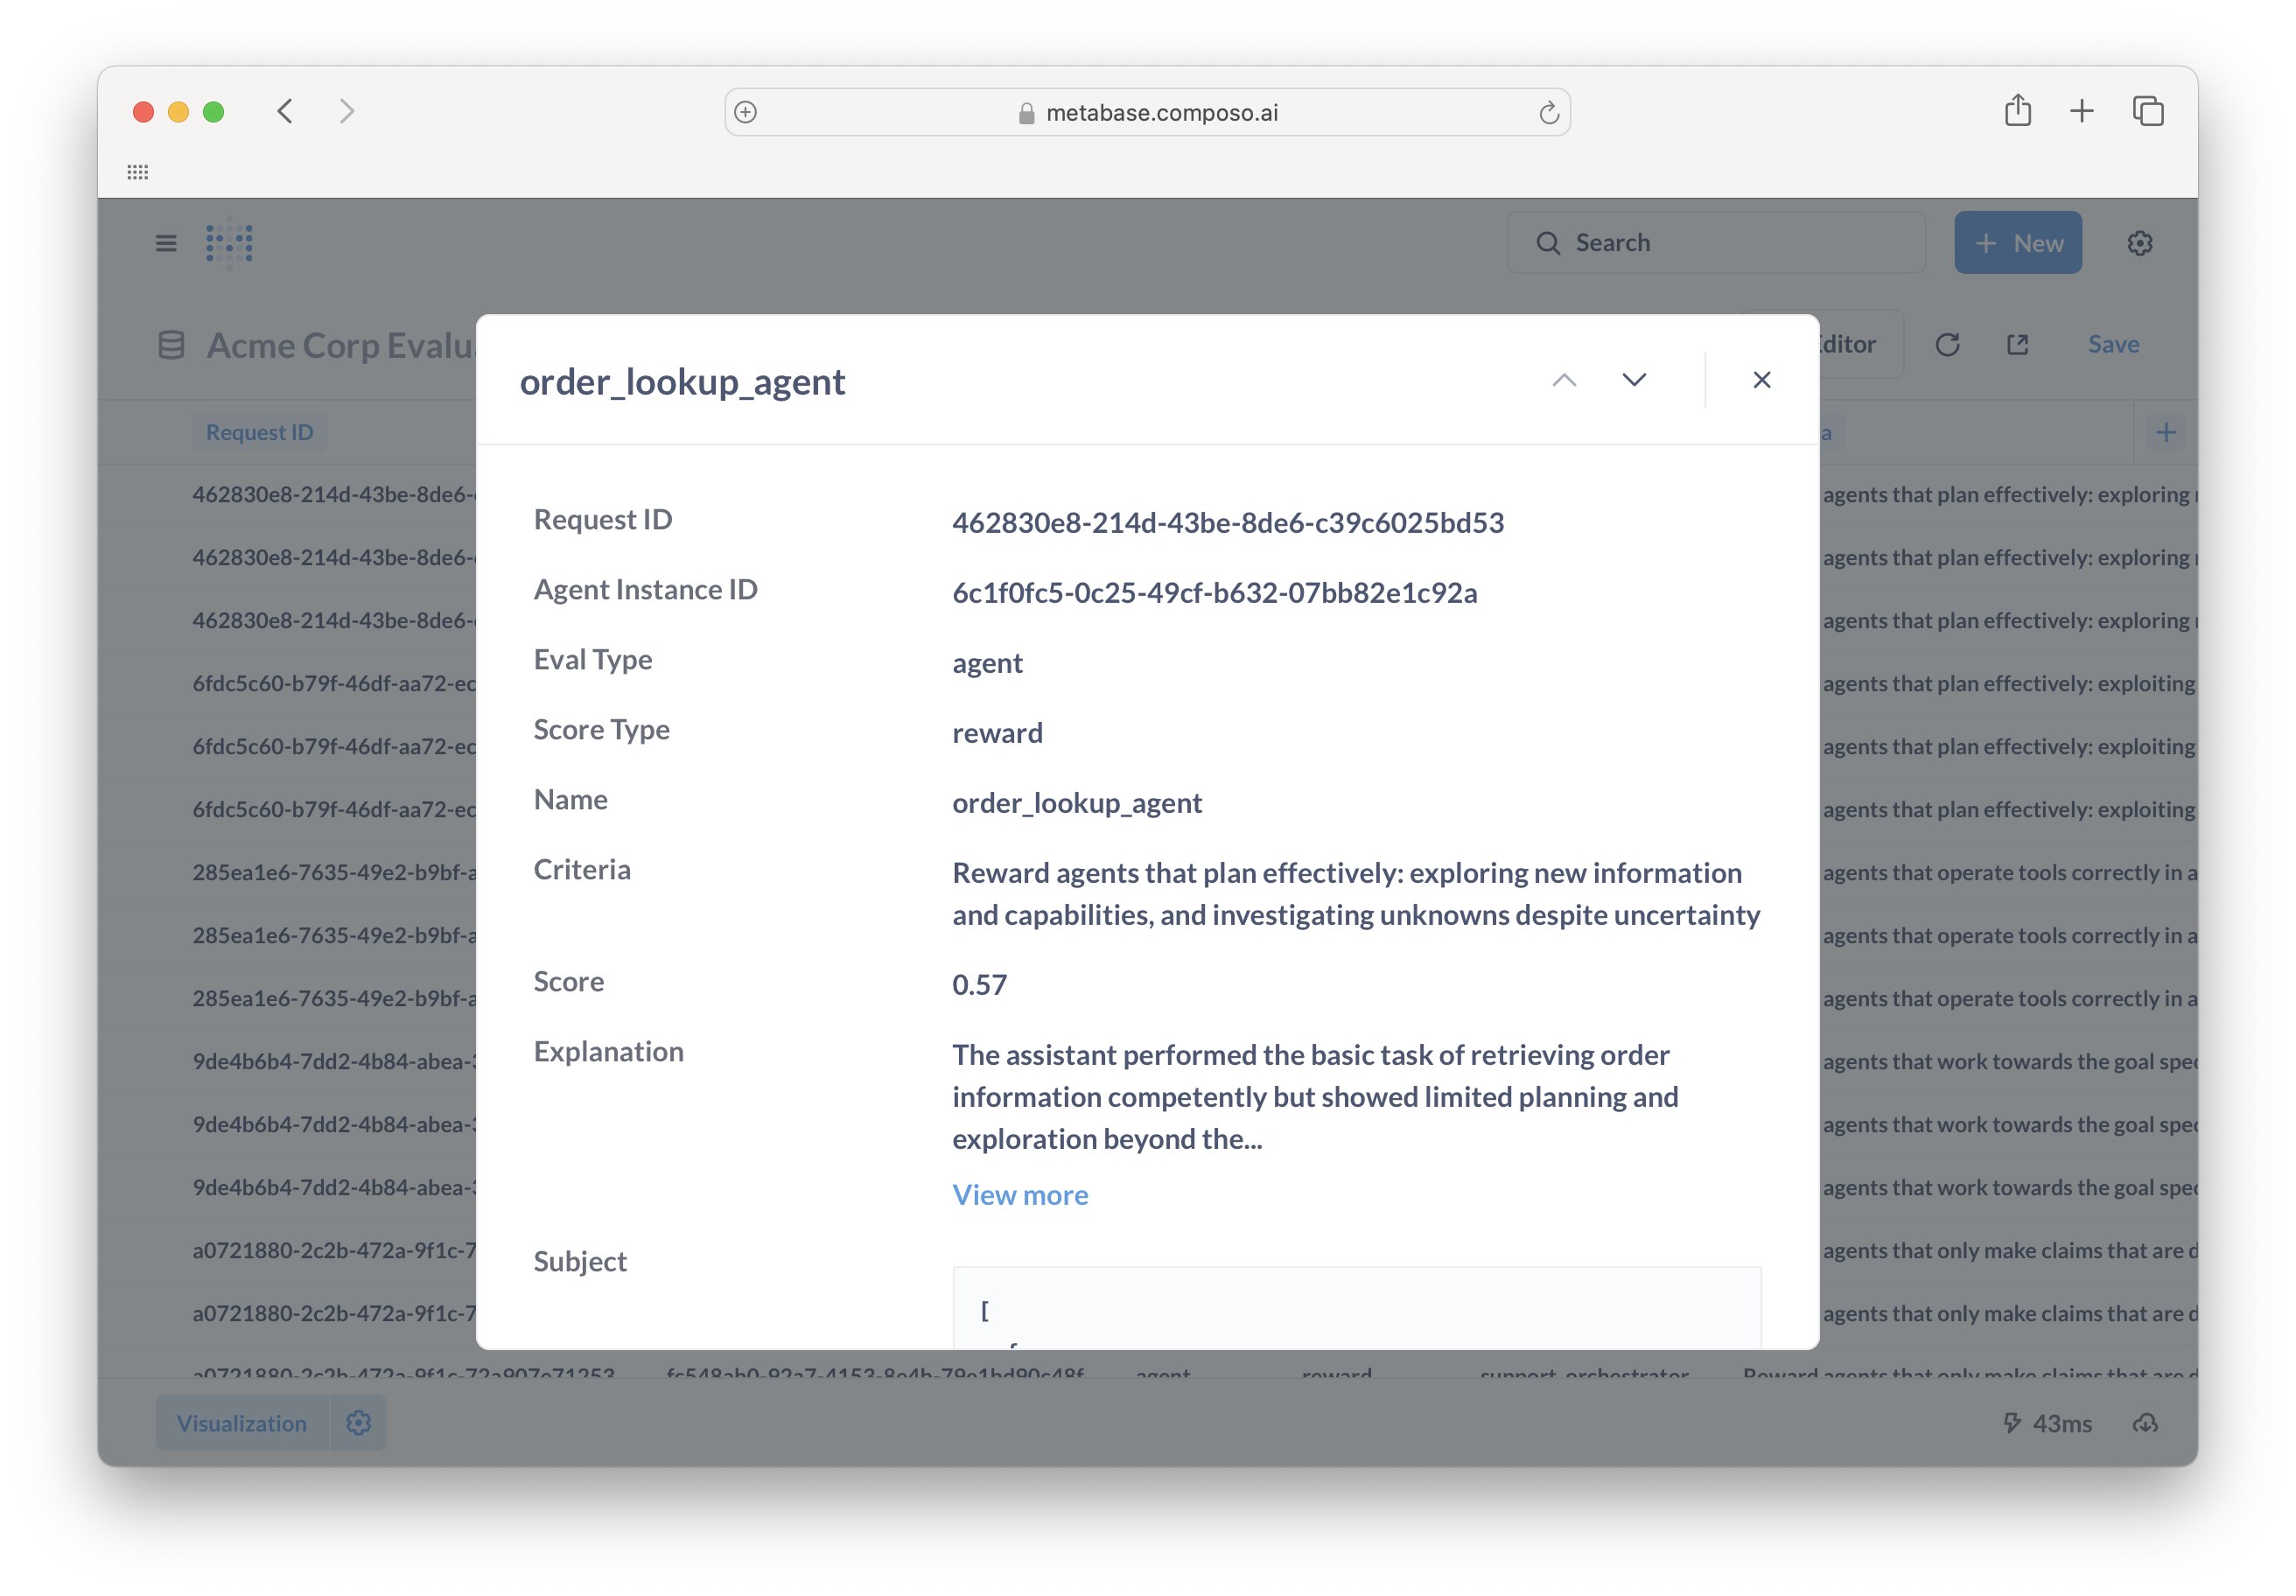
Click any row in your queries to see complete evaluation details including the full explanation, criteria, and subject data. This gives you full visibility into how each evaluation was scored and the reasoning behind it.
### Viewing Individual Evaluations
Click any row in your queries to see complete evaluation details including the full explanation, criteria, and subject data. This gives you full visibility into how each evaluation was scored and the reasoning behind it.
 ***
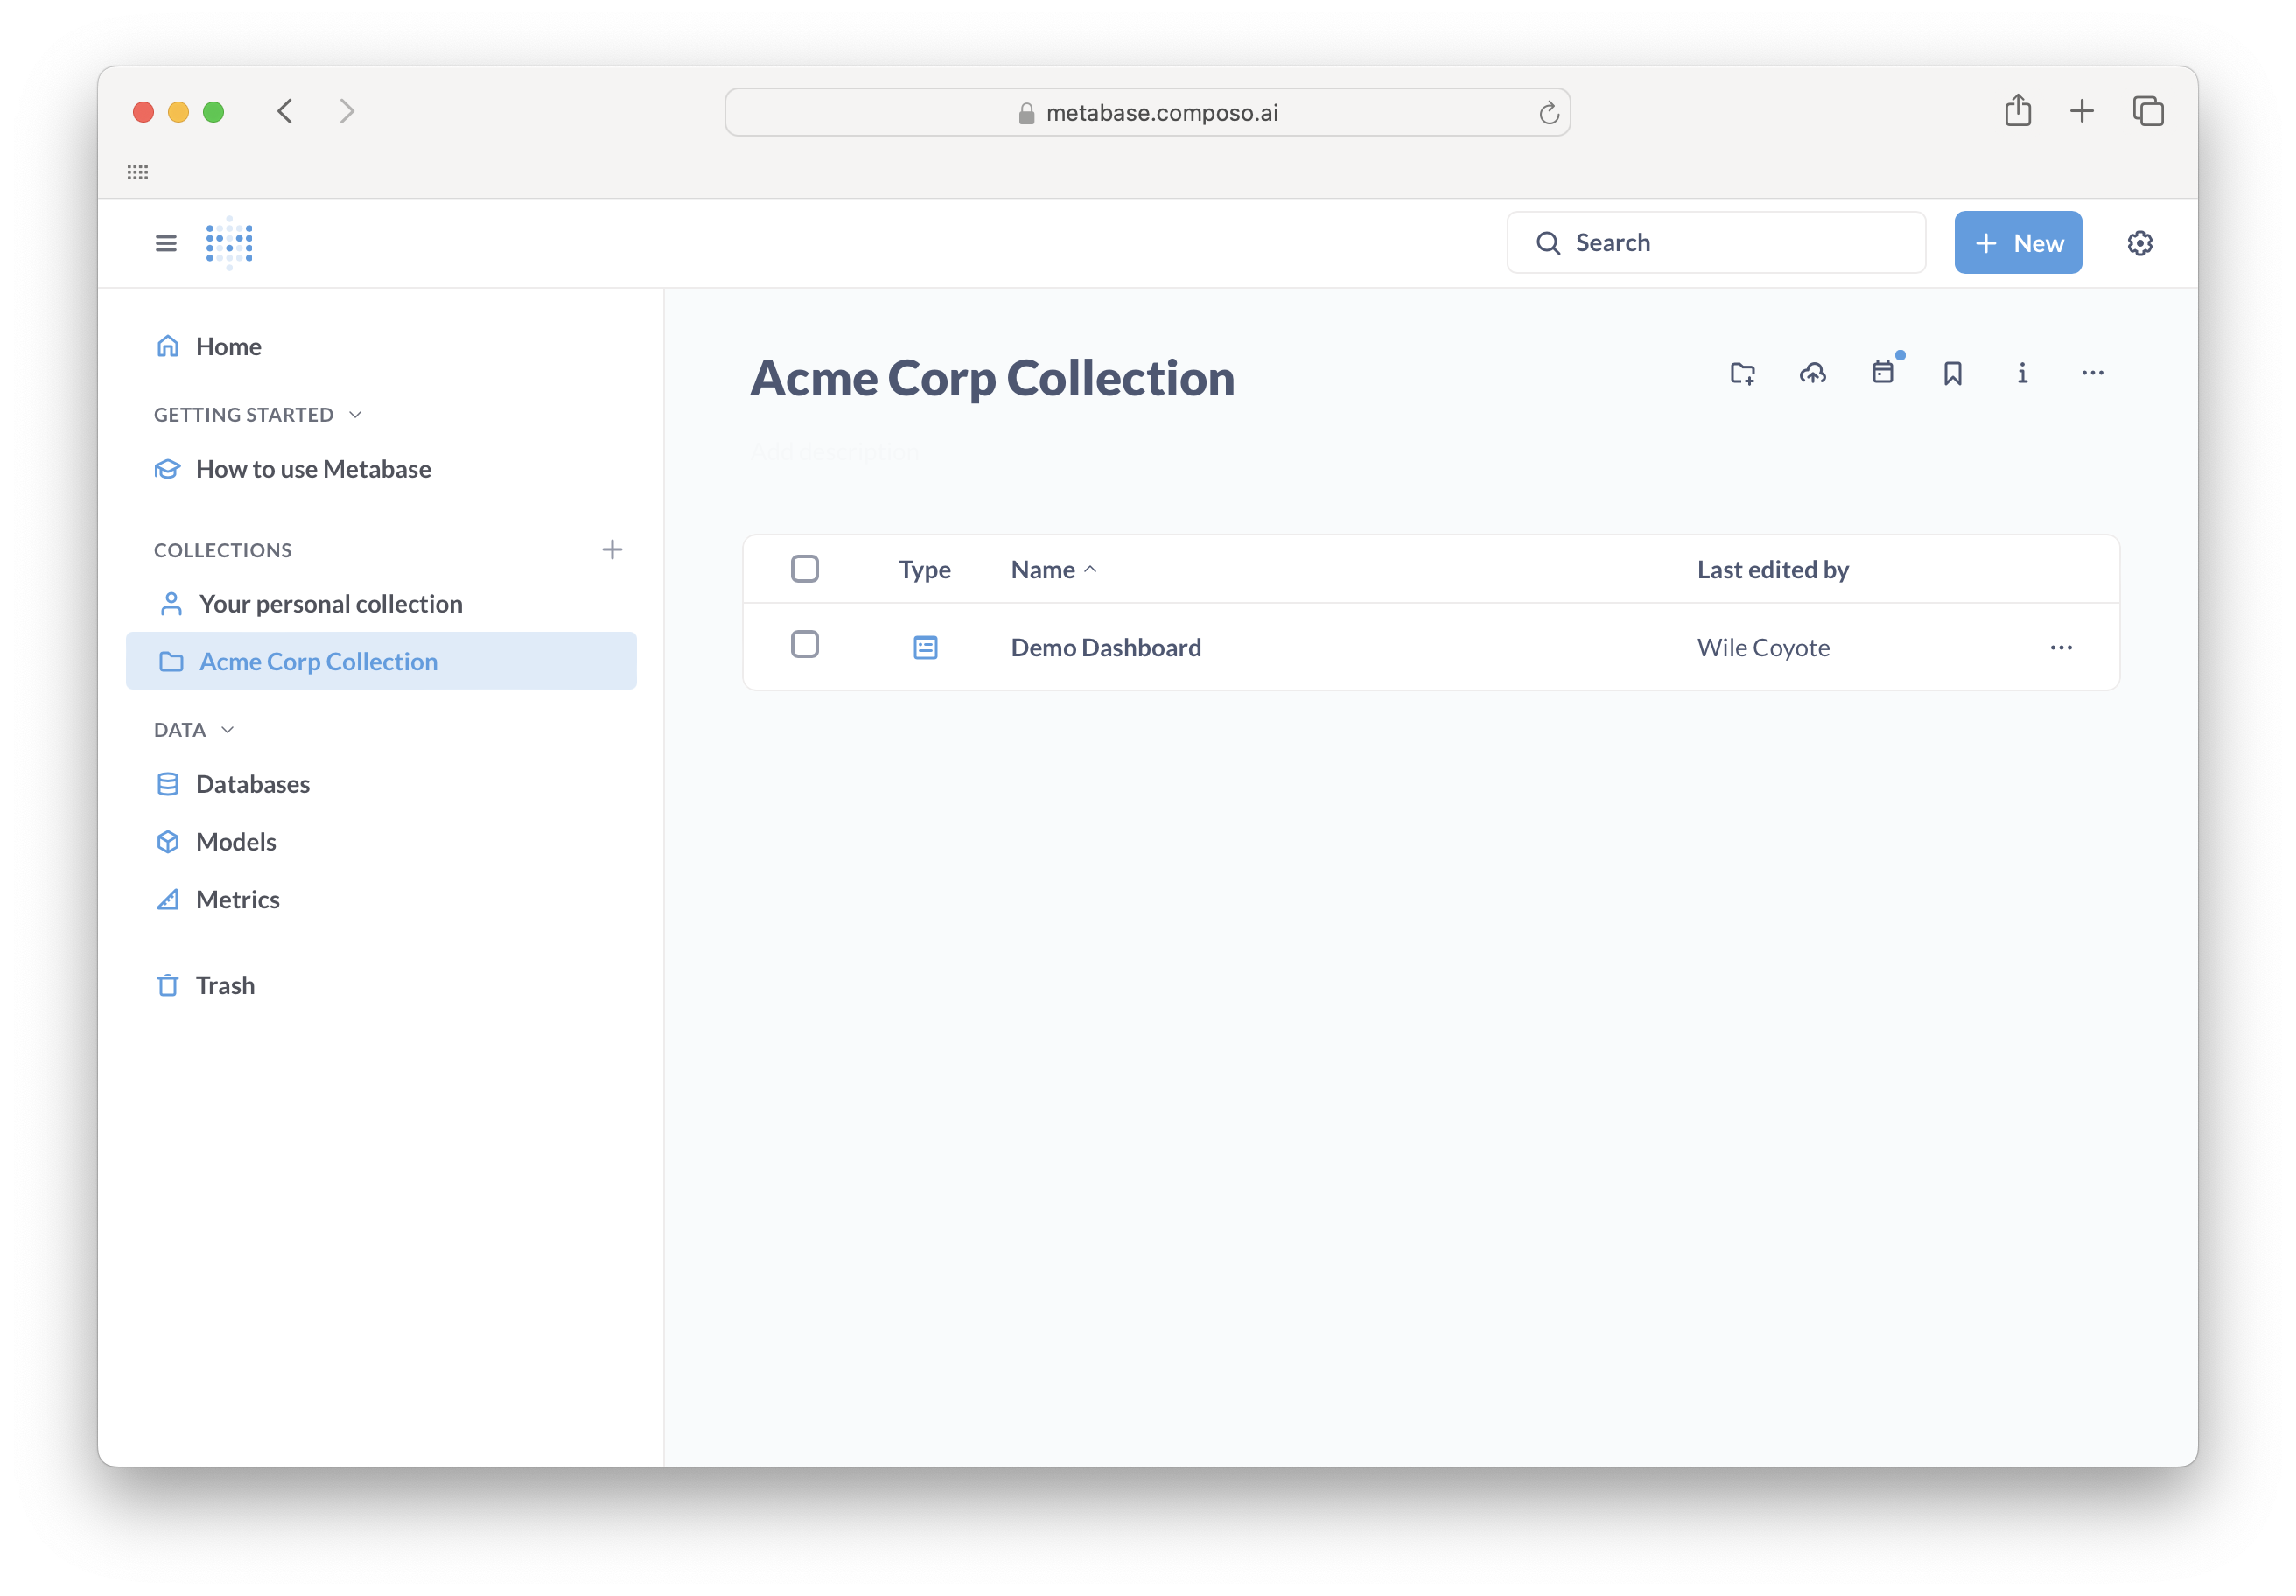
### Collections
* **Your personal collection**: Private workspace for your analyses
* **Team collections**: Shared dashboards and queries (e.g., "Acme Corp Collection")
Navigate collections from the sidebar or use the search bar to find existing queries.
***
### Collections
* **Your personal collection**: Private workspace for your analyses
* **Team collections**: Shared dashboards and queries (e.g., "Acme Corp Collection")
Navigate collections from the sidebar or use the search bar to find existing queries.
 ## Creating Your First Query
### Basic Query: Finding Red Flags
Let's find low-scoring evaluations that need attention.
1. Click **+ New** → **Question**
2. Select your **Evaluations** table
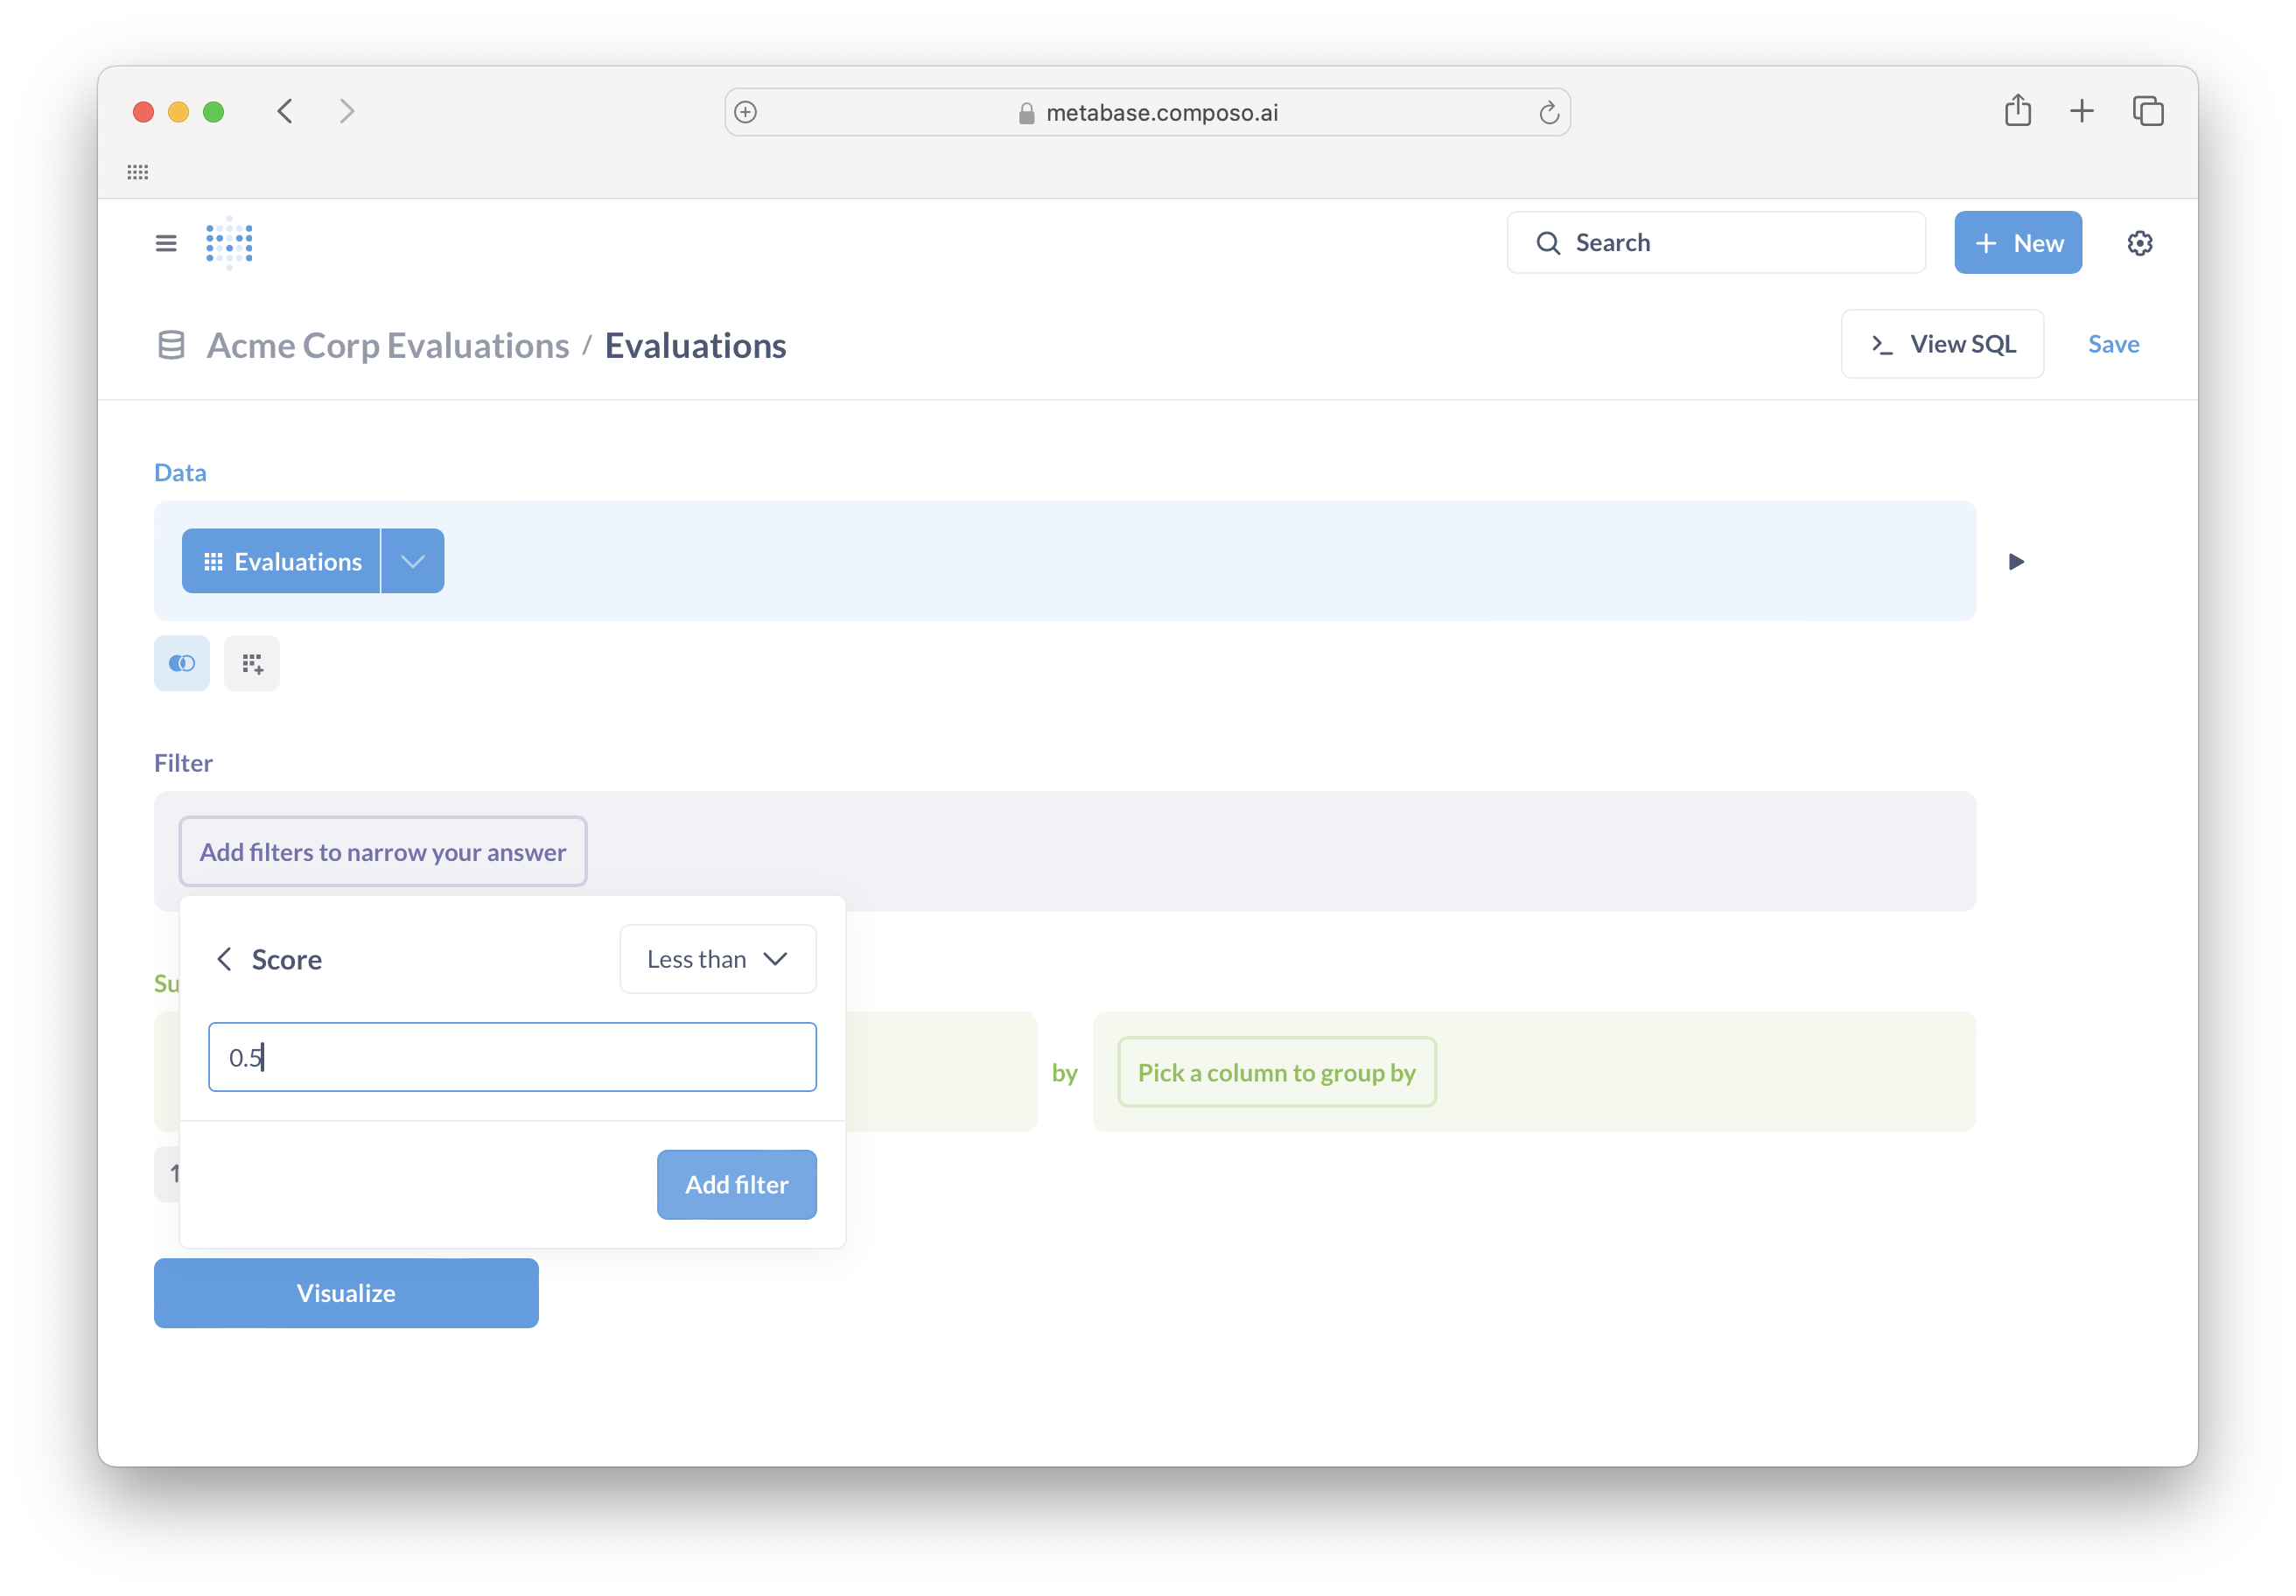
3. Click **Filter** → **Score** → **Less than** → enter `0.5`
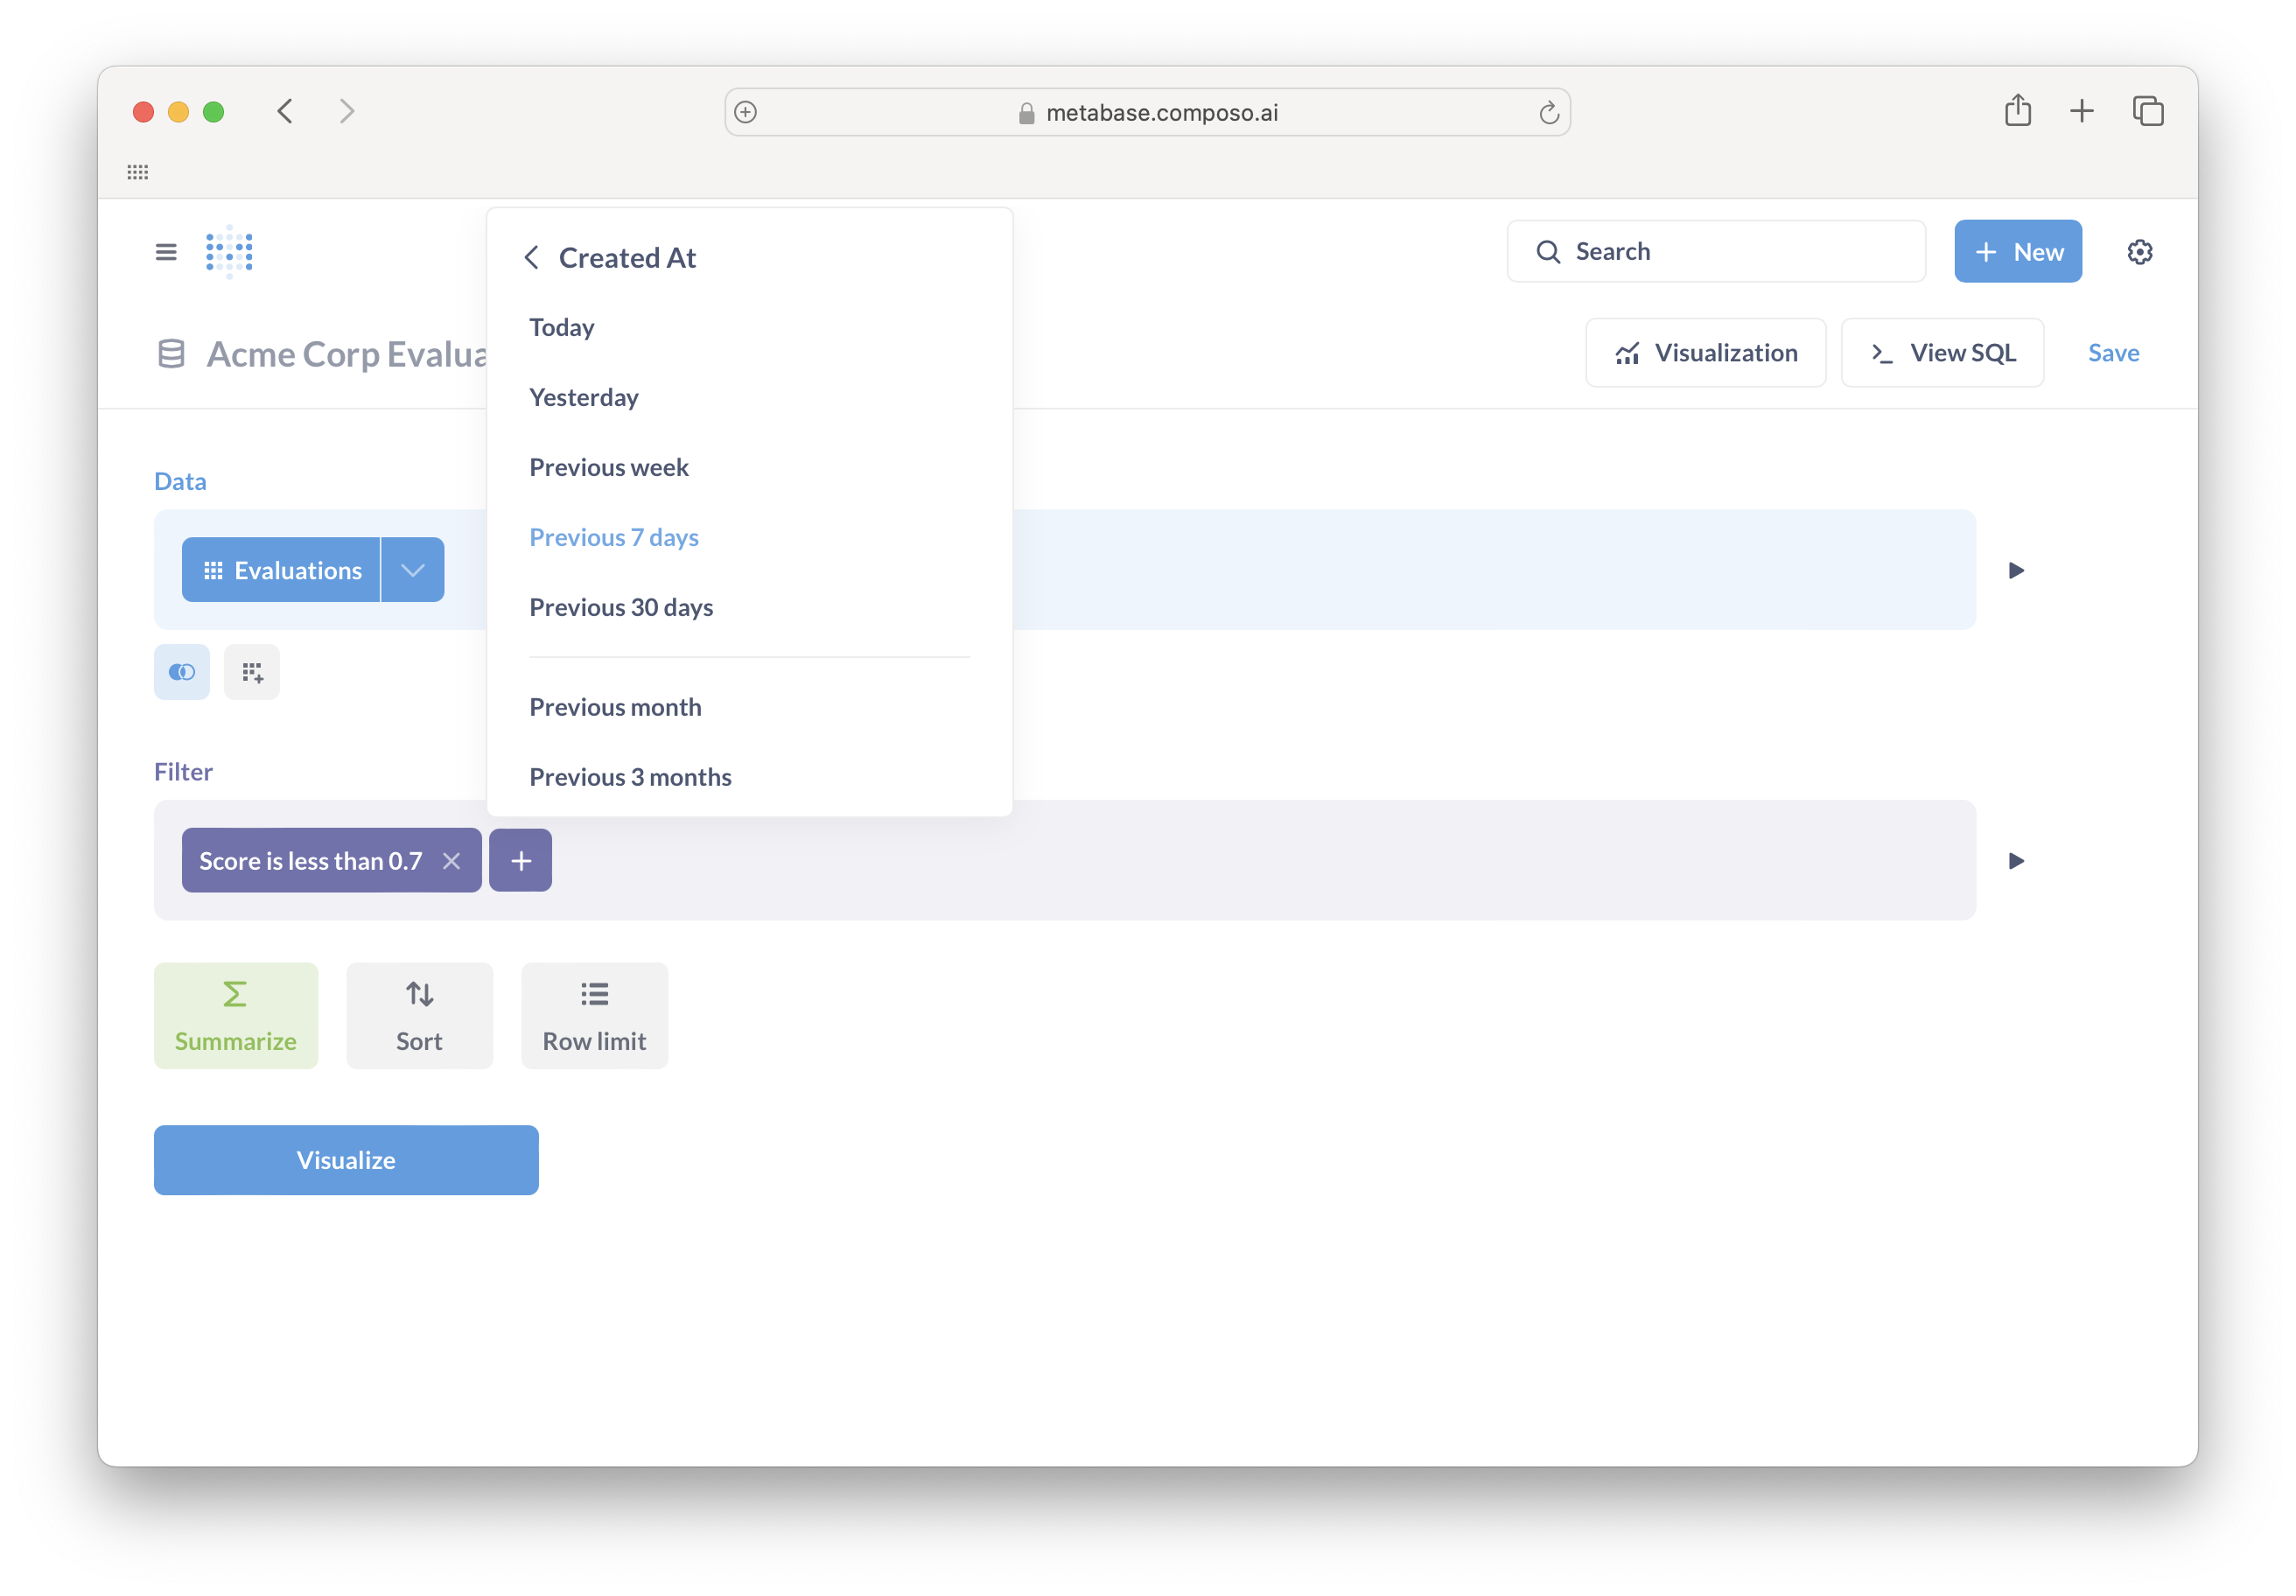
4. Click **Filter** again → **Created At** → select your time range
5. Click **Visualize**
## Creating Your First Query
### Basic Query: Finding Red Flags
Let's find low-scoring evaluations that need attention.
1. Click **+ New** → **Question**
2. Select your **Evaluations** table
3. Click **Filter** → **Score** → **Less than** → enter `0.5`
4. Click **Filter** again → **Created At** → select your time range
5. Click **Visualize**
 You can adjust the time range using the dropdown menu to view Today, Previous 7 days, Previous 30 days, or custom ranges.
 ***
## Visualizing Your Data
### Choosing a Visualization
After running a query, Metabase automatically suggests visualizations. Common types for evaluation data:
* **Line charts**: Track score trends over time
* **Bar charts**: Compare different agents or evaluation types
* **Tables**: See detailed row-by-row data
* **Numbers**: Display single metrics like average score or red flag rate
Click the **Visualization** button to change chart types and customize appearance.
***
## Visualizing Your Data
### Choosing a Visualization
After running a query, Metabase automatically suggests visualizations. Common types for evaluation data:
* **Line charts**: Track score trends over time
* **Bar charts**: Compare different agents or evaluation types
* **Tables**: See detailed row-by-row data
* **Numbers**: Display single metrics like average score or red flag rate
Click the **Visualization** button to change chart types and customize appearance.
 **[Metabase visualization guide](https://www.metabase.com/docs/latest/questions/sharing/visualizing-results)**
***
## Summarizing Data
### Aggregations and Grouping
Instead of viewing raw rows, you can summarize your data:
1. Click **Summarize**
2. Choose a metric: **Count of rows**, **Average of Score**, etc.
3. Add **Group by**: **Created At** (for time series) or **Name** (to compare evaluations)
**Common patterns:**
* **Average Score by Created At** → See quality trends over time
* **Count by Name** → Which evaluations run most frequently
* **Average Score by Agent Instance ID** → Compare agent performance
**[Metabase summarizing guide](https://www.metabase.com/docs/latest/questions/query-builder/introduction#summarizing-and-grouping-by)**
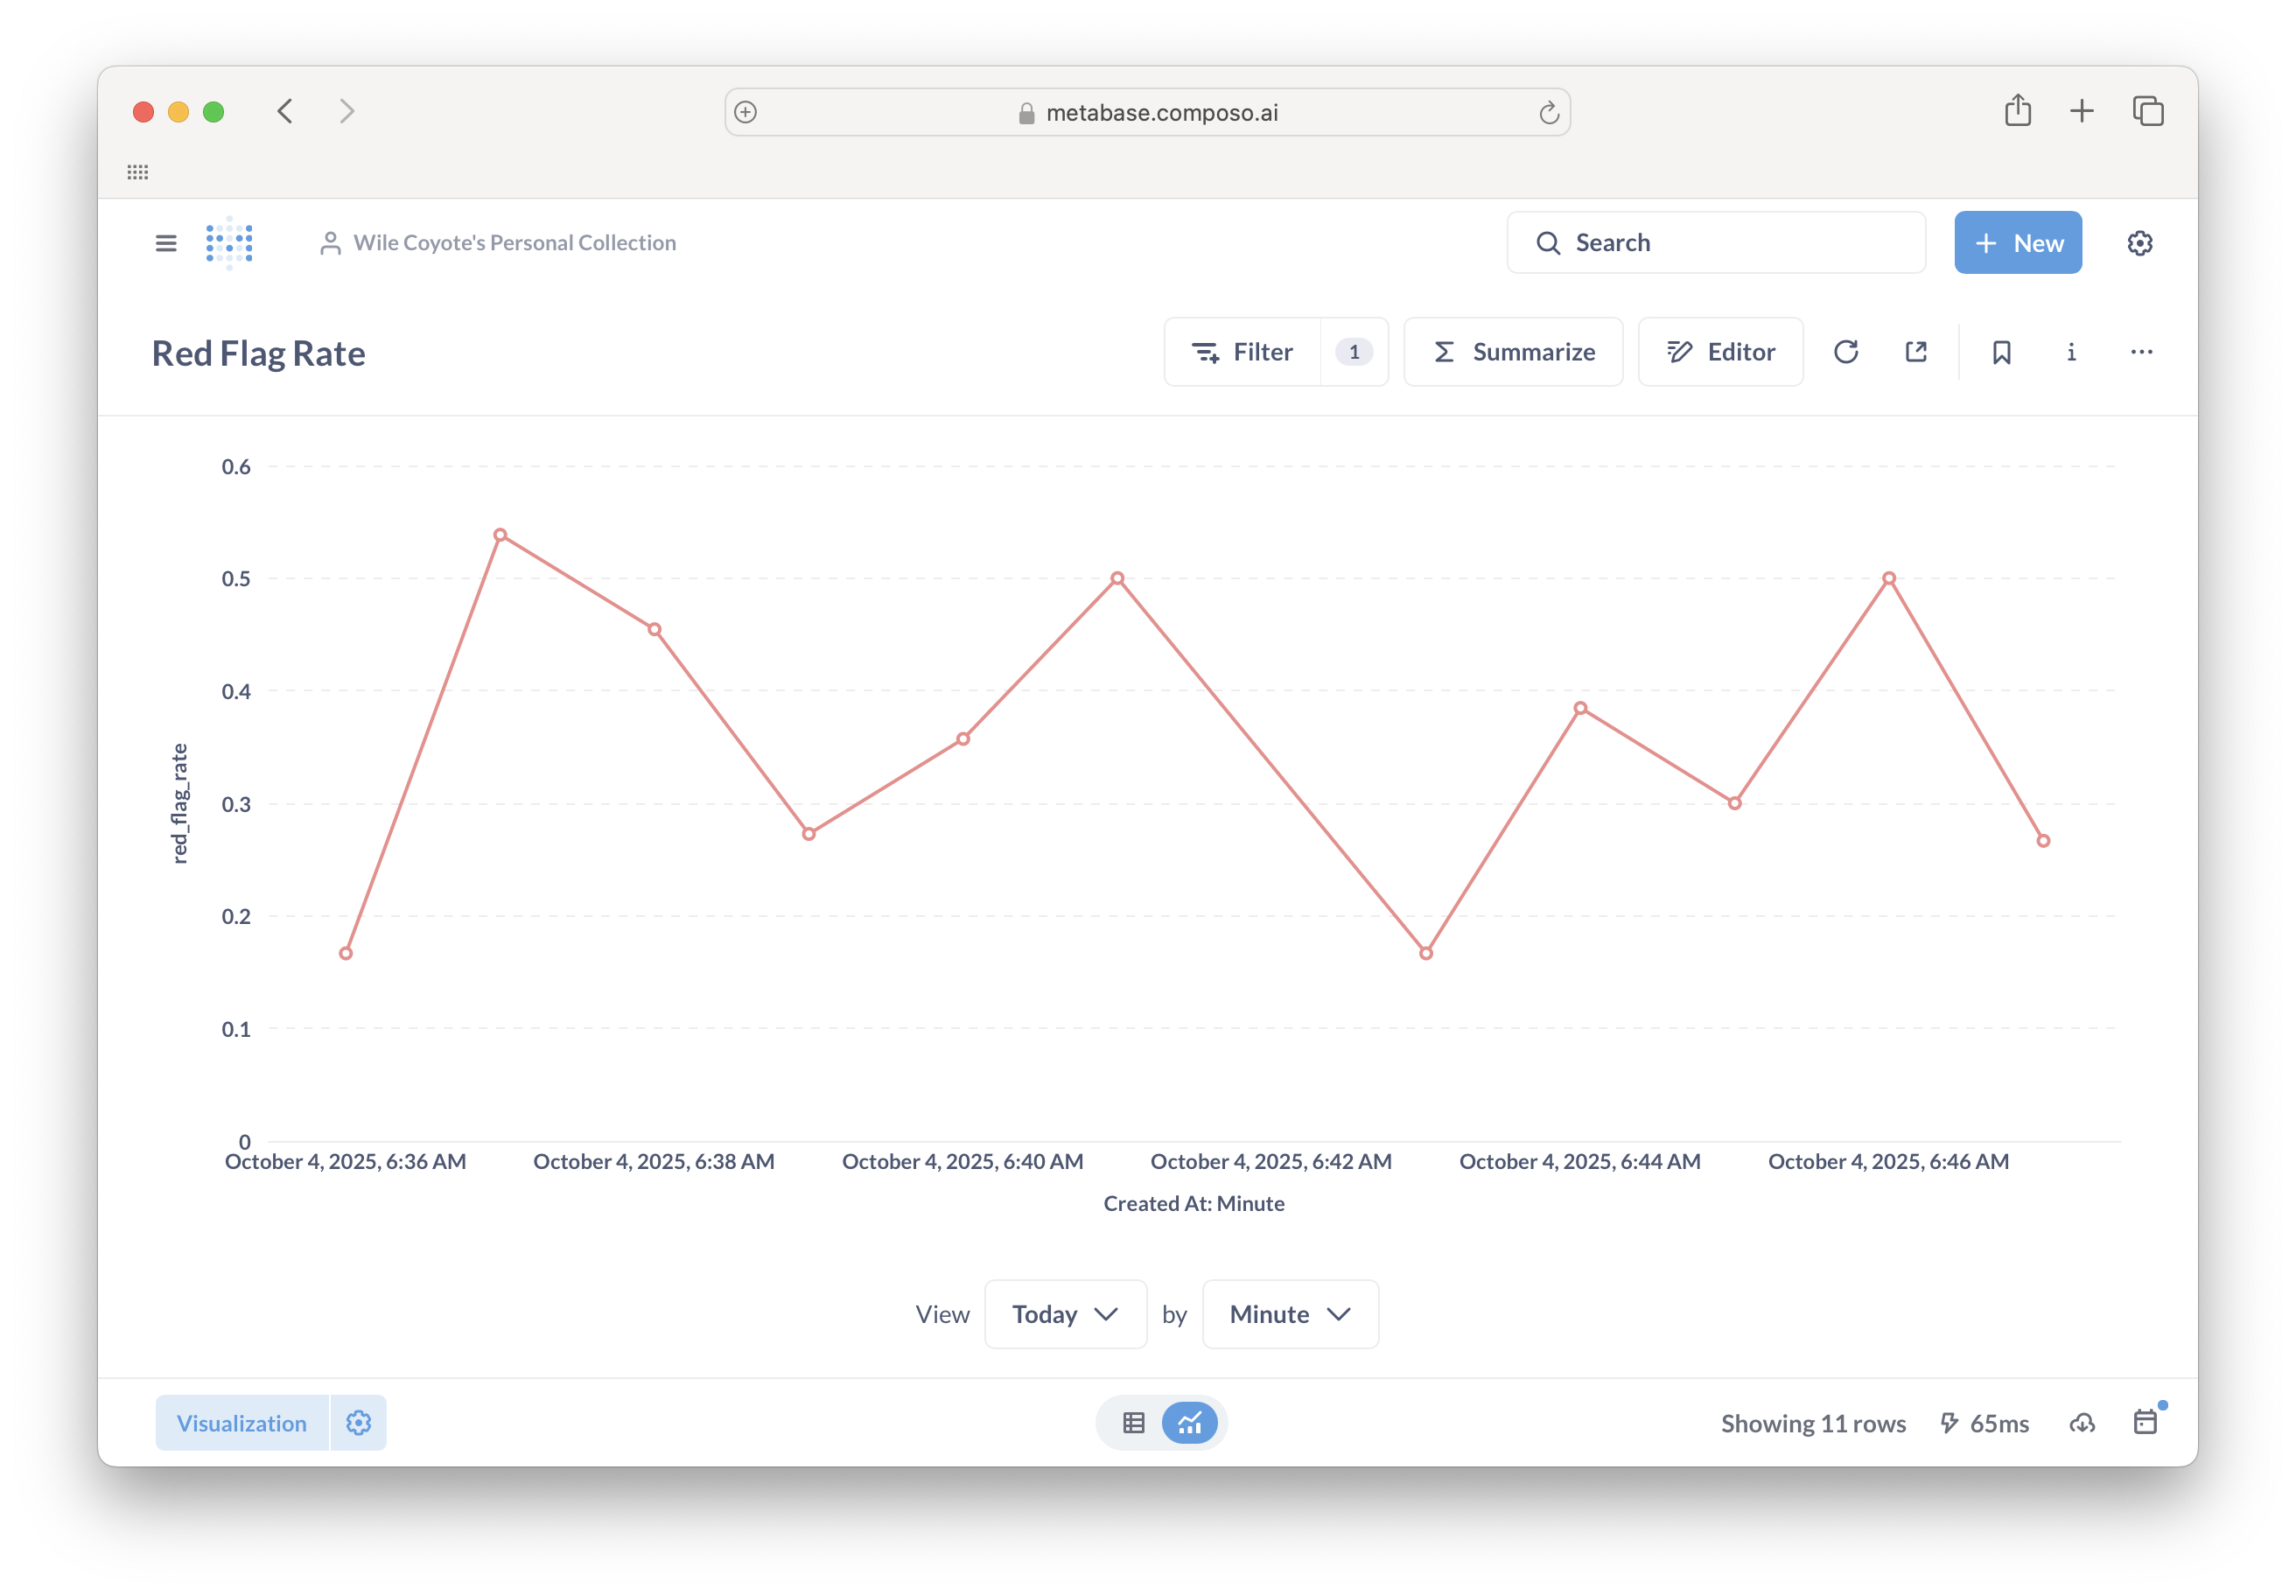
### Custom Expressions: Red Flag Rate
Create a custom metric to calculate the percentage of low-scoring evaluations:
1. Click **Summarize** → **Custom Expression**
2. Enter:
```
CountIf([Score] < 0.5) /
(CountIf([Score] > 0.5) + CountIf([Score] < 0.5))
```
3. Name it "red\_flag\_rate"
4. Group by **Created At: Minute** (or Hour/Day)
**[Metabase visualization guide](https://www.metabase.com/docs/latest/questions/sharing/visualizing-results)**
***
## Summarizing Data
### Aggregations and Grouping
Instead of viewing raw rows, you can summarize your data:
1. Click **Summarize**
2. Choose a metric: **Count of rows**, **Average of Score**, etc.
3. Add **Group by**: **Created At** (for time series) or **Name** (to compare evaluations)
**Common patterns:**
* **Average Score by Created At** → See quality trends over time
* **Count by Name** → Which evaluations run most frequently
* **Average Score by Agent Instance ID** → Compare agent performance
**[Metabase summarizing guide](https://www.metabase.com/docs/latest/questions/query-builder/introduction#summarizing-and-grouping-by)**
### Custom Expressions: Red Flag Rate
Create a custom metric to calculate the percentage of low-scoring evaluations:
1. Click **Summarize** → **Custom Expression**
2. Enter:
```
CountIf([Score] < 0.5) /
(CountIf([Score] > 0.5) + CountIf([Score] < 0.5))
```
3. Name it "red\_flag\_rate"
4. Group by **Created At: Minute** (or Hour/Day)
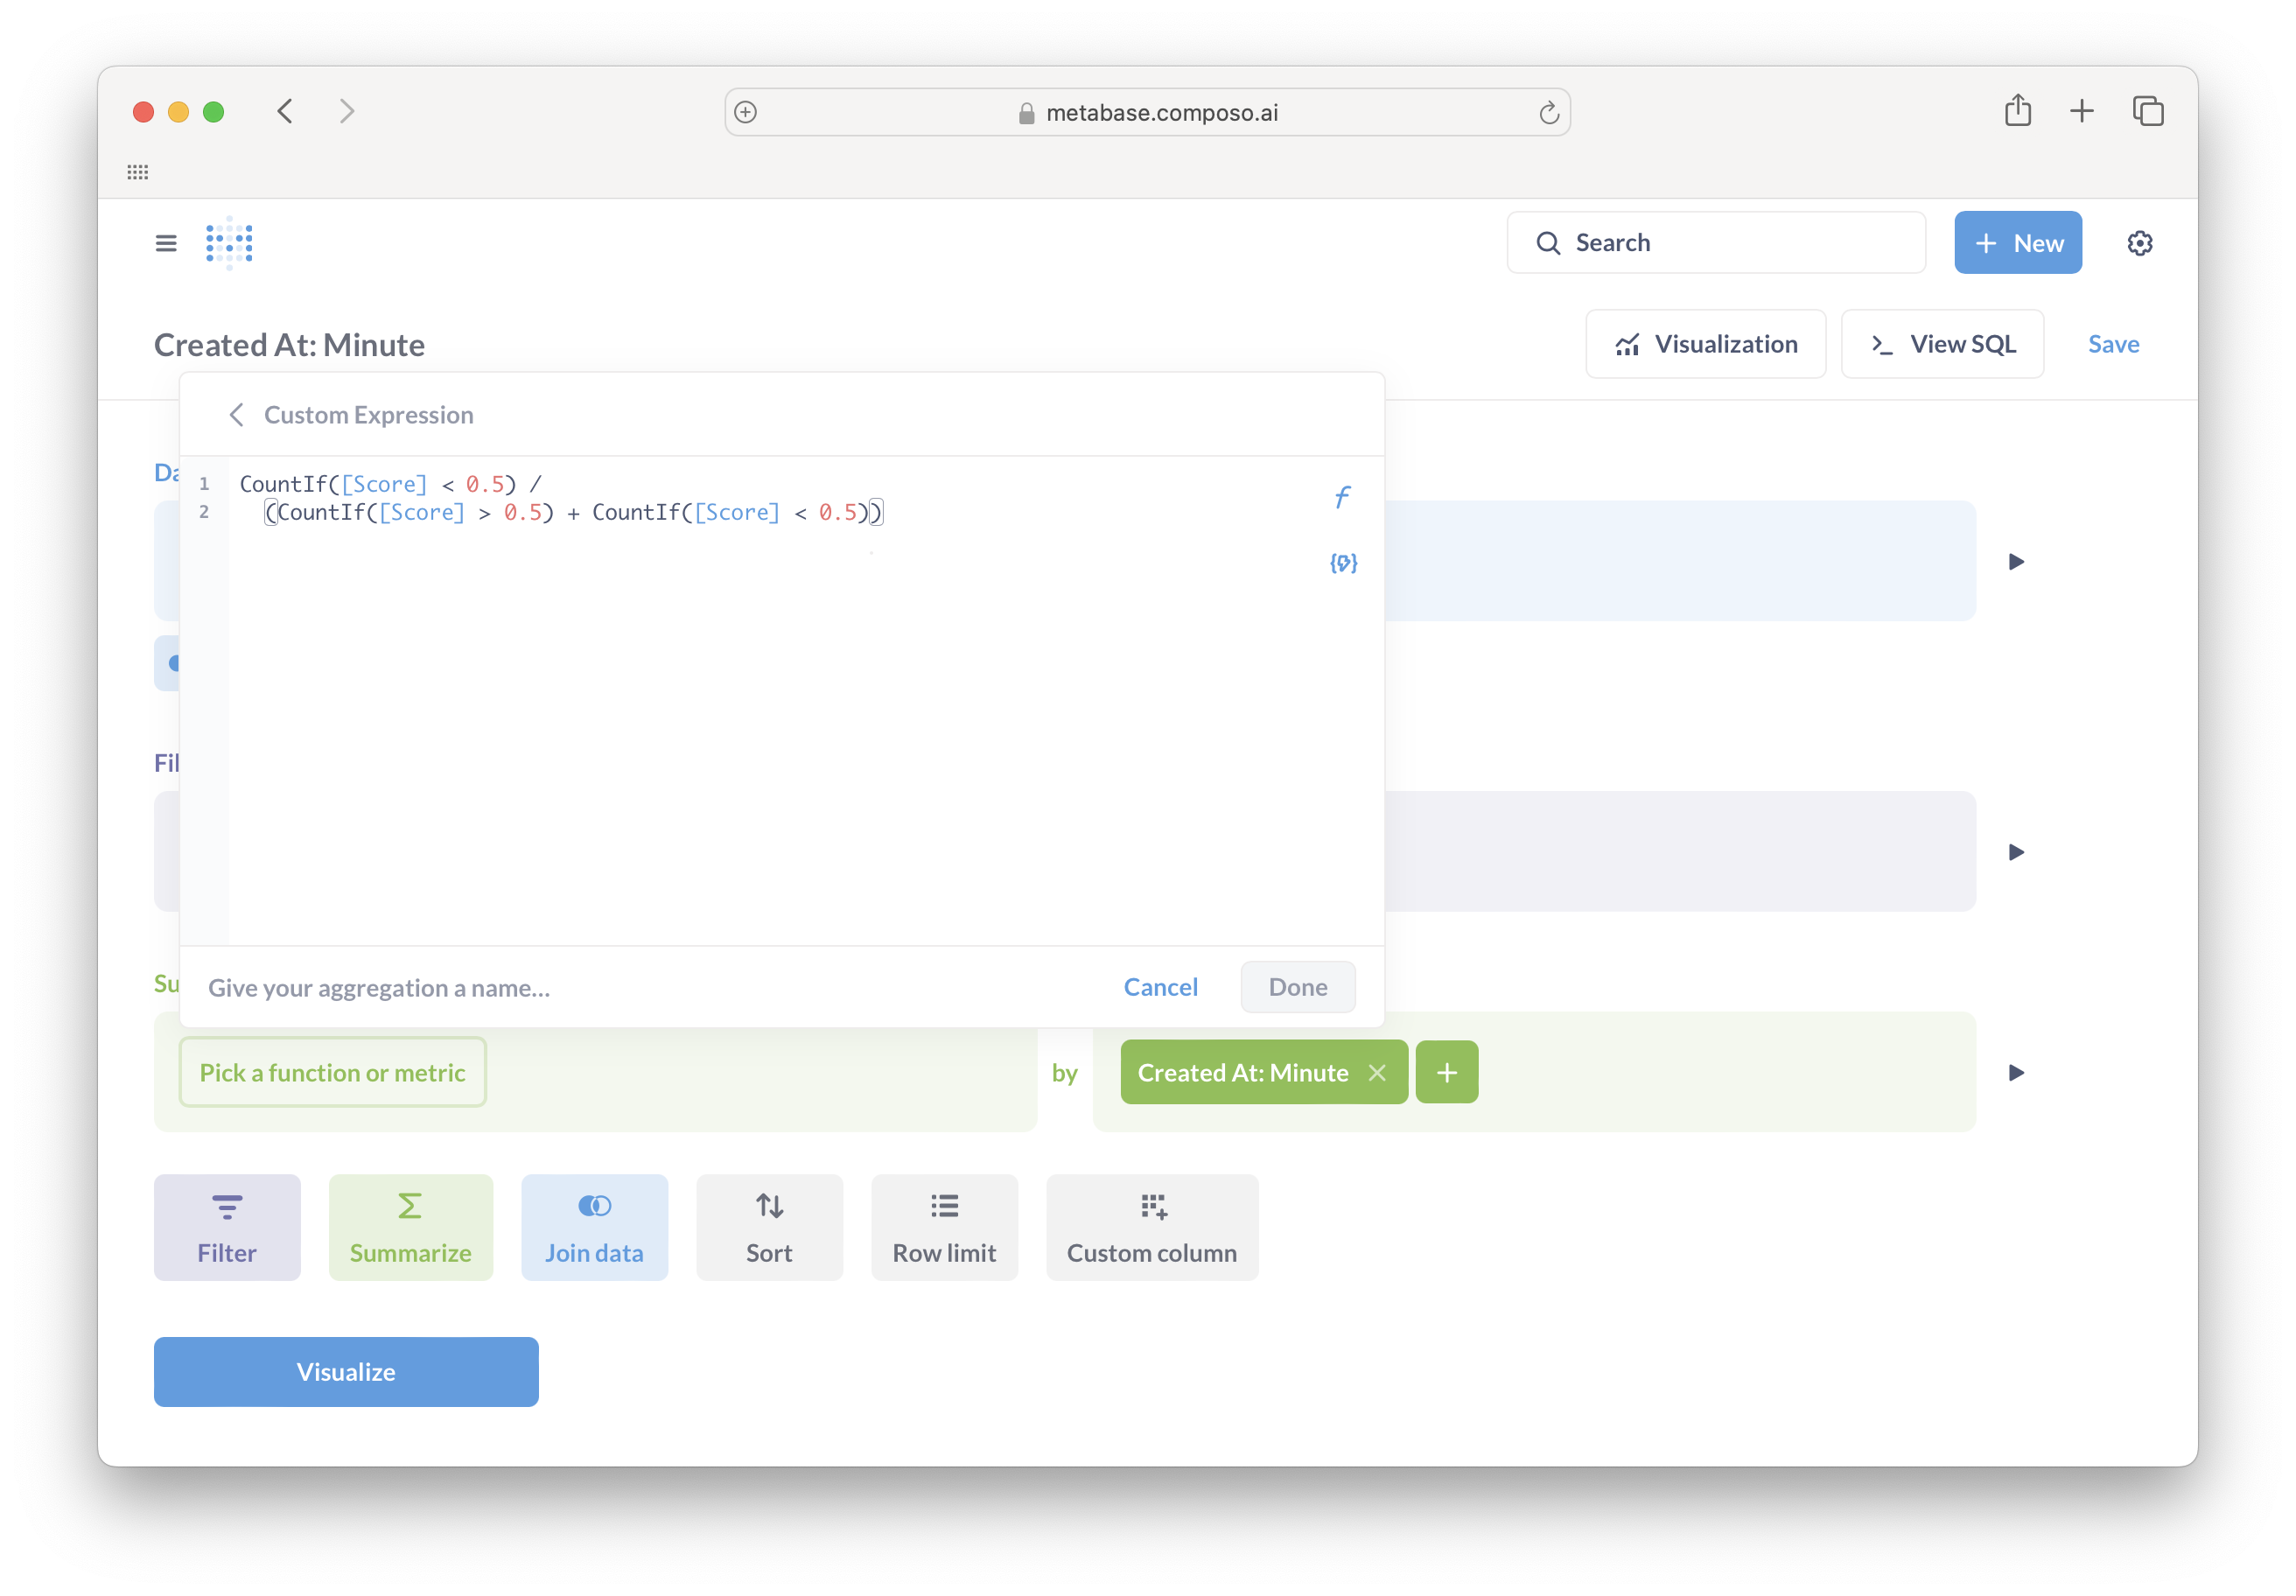 This creates a time-series showing what percentage of evaluations are concerning.
**[Metabase expressions guide](https://www.metabase.com/docs/latest/questions/query-builder/expressions)**
***
## Building Dashboards
### Creating a Dashboard
Save your most important queries and combine them into dashboards:
1. After creating a query, click **Save** and give it a descriptive name
2. Click **+ New** → **Dashboard**
3. Name your dashboard (e.g., "Production Quality Monitor")
4. Click **Add a saved question** and select your queries
5. Resize and arrange charts as needed
### Dashboard Features
* **Tabs**: Organize related metrics (e.g., "Quality By Agent" vs "Red Flags")
* **Dashboard filters**: Add filters that apply to multiple charts simultaneously
* **Auto-refresh**: Set dashboards to update automatically every few minutes
* **Sharing**: Click the sharing icon to share with teammates or generate public links
**[Metabase dashboard guide](https://www.metabase.com/docs/latest/dashboards/start)**
**[Dashboard filters](https://www.metabase.com/docs/latest/dashboards/filters)**
***
## Advanced Filtering
Combine multiple filters to drill down into your data:
* **Score ranges**: Score is between 0.3 and 0.7
* **Text search**: Criteria contains "hallucination"
* **Multiple time ranges**: Created At is Previous 7 days AND Created At Hour of day is between 9 and 17
* **Specific agents**: Agent Instance ID is one of \[list of IDs]
Click the **+** next to existing filters to add more conditions.
**[Metabase filtering guide](https://www.metabase.com/docs/latest/questions/query-builder/introduction#filtering)**
***
## SQL Queries (Advanced)
For complex queries, use the native SQL editor:
1. Click **+ New** → **Question** → **Native query**
2. Write your SQL against the `evaluations` table
3. Use variables with `{{variable_name}}` to make queries reusable
Example:
```sql theme={null}
SELECT
date_trunc('hour', created_at) as hour,
name,
avg(score) as avg_score,
count(*) as eval_count
FROM "external"."evaluations"
WHERE created_at > current_date - interval '7 days'
AND score < 0.5
GROUP BY 1, 2
ORDER BY 1 DESC
```
**[Metabase SQL guide](https://www.metabase.com/docs/latest/questions/native-editor/writing-sql)**
## Getting Help
### Metabase Resources
* **[Documentation](https://www.metabase.com/docs/latest/)**
* **[Learning Center](https://www.metabase.com/learn/)**
* **[Video Tutorials](https://www.metabase.com/learn/videos)**
### Composo Support
* **Data questions**: Contact your Composo account team
* **Technical support**: [support@composo.ai](mailto:support@composo.ai)
* **Evaluation schema**: See reference below
***
This creates a time-series showing what percentage of evaluations are concerning.
**[Metabase expressions guide](https://www.metabase.com/docs/latest/questions/query-builder/expressions)**
***
## Building Dashboards
### Creating a Dashboard
Save your most important queries and combine them into dashboards:
1. After creating a query, click **Save** and give it a descriptive name
2. Click **+ New** → **Dashboard**
3. Name your dashboard (e.g., "Production Quality Monitor")
4. Click **Add a saved question** and select your queries
5. Resize and arrange charts as needed
### Dashboard Features
* **Tabs**: Organize related metrics (e.g., "Quality By Agent" vs "Red Flags")
* **Dashboard filters**: Add filters that apply to multiple charts simultaneously
* **Auto-refresh**: Set dashboards to update automatically every few minutes
* **Sharing**: Click the sharing icon to share with teammates or generate public links
**[Metabase dashboard guide](https://www.metabase.com/docs/latest/dashboards/start)**
**[Dashboard filters](https://www.metabase.com/docs/latest/dashboards/filters)**
***
## Advanced Filtering
Combine multiple filters to drill down into your data:
* **Score ranges**: Score is between 0.3 and 0.7
* **Text search**: Criteria contains "hallucination"
* **Multiple time ranges**: Created At is Previous 7 days AND Created At Hour of day is between 9 and 17
* **Specific agents**: Agent Instance ID is one of \[list of IDs]
Click the **+** next to existing filters to add more conditions.
**[Metabase filtering guide](https://www.metabase.com/docs/latest/questions/query-builder/introduction#filtering)**
***
## SQL Queries (Advanced)
For complex queries, use the native SQL editor:
1. Click **+ New** → **Question** → **Native query**
2. Write your SQL against the `evaluations` table
3. Use variables with `{{variable_name}}` to make queries reusable
Example:
```sql theme={null}
SELECT
date_trunc('hour', created_at) as hour,
name,
avg(score) as avg_score,
count(*) as eval_count
FROM "external"."evaluations"
WHERE created_at > current_date - interval '7 days'
AND score < 0.5
GROUP BY 1, 2
ORDER BY 1 DESC
```
**[Metabase SQL guide](https://www.metabase.com/docs/latest/questions/native-editor/writing-sql)**
## Getting Help
### Metabase Resources
* **[Documentation](https://www.metabase.com/docs/latest/)**
* **[Learning Center](https://www.metabase.com/learn/)**
* **[Video Tutorials](https://www.metabase.com/learn/videos)**
### Composo Support
* **Data questions**: Contact your Composo account team
* **Technical support**: [support@composo.ai](mailto:support@composo.ai)
* **Evaluation schema**: See reference below
***